Gene Page: PEAK1
Summary ?
| GeneID | 79834 |
| Symbol | PEAK1 |
| Synonyms | SGK269 |
| Description | pseudopodium enriched atypical kinase 1 |
| Reference | MIM:614248|HGNC:HGNC:29431|Ensembl:ENSG00000173517| |
| Gene type | protein-coding |
| Map location | 15q24.3 |
| Pascal p-value | 0.166 |
| DMG | 1 (# studies) |
| eGene | Cerebellum Cortex Hippocampus Hypothalamus Nucleus accumbens basal ganglia |
Gene in Data Sources
| Gene set name | Method of gene set | Description | Info |
|---|---|---|---|
| CV:GWASdb | Genome-wide Association Studies | GWASdb records for schizophrenia | |
| CV:PGCnp | Genome-wide Association Study | GWAS | |
| DMG:Montano_2016 | Genome-wide DNA methylation analysis | This dataset includes 172 replicated associations between CpGs with schizophrenia. | 1 |
Section I. Genetics and epigenetics annotation
 Differentially methylated gene
| Probe | Chromosome | Position | Nearest gene | P (dis) | Beta (dis) | FDR (dis) | Study |
|---|---|---|---|---|---|---|---|
| cg23387863 | 15 | 77472416 | PEAK1 | 1.02E-6 | 0.01 | 0.015 | DMG:Montano_2016 |
Section II. Transcriptome annotation
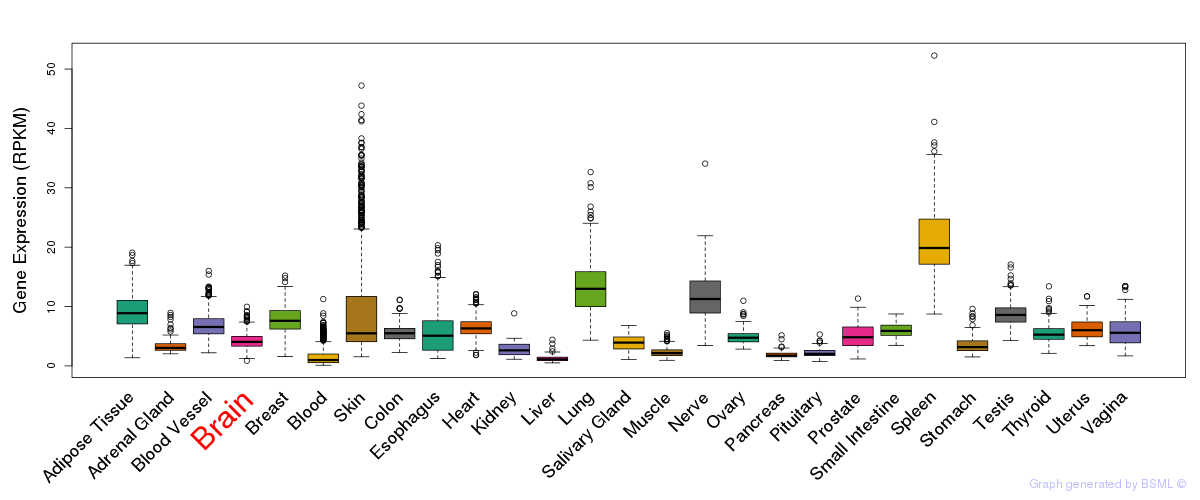
General gene expression (GTEx)
Gene expression of temporal and spatial changes (BrainSpan)
Footnote:
SC: sub-cortical regions; SM: sensory-motor regions; FC: frontal cortex; and TP: temporal-parietal cortex
ST1: fetal (13 - 26 postconception weeks), ST2: early infancy to late childhood (4 months to 11 years), and ST3: adolescence to adulthood (13 - 23 years)
The bar shown representes the lower 25% and upper 25% of the expression distribution.
Top co-expressed genes in brain regions
| Top 10 positively co-expressed genes | ||
| Gene | Pearson's Correlation | Spearman's Correlation |
| GCNT2 | 0.83 | 0.79 |
| CENPO | 0.81 | 0.78 |
| GINS3 | 0.81 | 0.72 |
| SPATA13 | 0.81 | 0.67 |
| PRKD3 | 0.81 | 0.69 |
| MAP3K1 | 0.80 | 0.76 |
| POU3F4 | 0.80 | 0.69 |
| RACGAP1P | 0.80 | 0.82 |
| PARD3 | 0.79 | 0.50 |
| SOX6 | 0.78 | 0.70 |
| Top 10 negatively co-expressed genes | ||
| Gene | Pearson's Correlation | Spearman's Correlation |
| AF347015.31 | -0.47 | -0.72 |
| MT-CO2 | -0.46 | -0.72 |
| AF347015.33 | -0.44 | -0.69 |
| MT-CYB | -0.44 | -0.70 |
| AF347015.8 | -0.44 | -0.71 |
| AF347015.2 | -0.44 | -0.72 |
| AF347015.27 | -0.44 | -0.68 |
| AF347015.15 | -0.43 | -0.69 |
| IFI27 | -0.42 | -0.67 |
| C5orf53 | -0.42 | -0.56 |
Section V. Pathway annotation
| Pathway name | Pathway size | # SZGR 2.0 genes in pathway | Info |
|---|---|---|---|
| GRAESSMANN APOPTOSIS BY DOXORUBICIN DN | 1781 | 1082 | All SZGR 2.0 genes in this pathway |
| GRAESSMANN RESPONSE TO MC AND DOXORUBICIN DN | 770 | 415 | All SZGR 2.0 genes in this pathway |
| STARK HYPPOCAMPUS 22Q11 DELETION UP | 53 | 40 | All SZGR 2.0 genes in this pathway |
| IVANOVA HEMATOPOIESIS STEM CELL | 254 | 164 | All SZGR 2.0 genes in this pathway |
| IVANOVA HEMATOPOIESIS STEM CELL AND PROGENITOR | 681 | 420 | All SZGR 2.0 genes in this pathway |
| DURCHDEWALD SKIN CARCINOGENESIS DN | 264 | 168 | All SZGR 2.0 genes in this pathway |
| MARSON BOUND BY FOXP3 STIMULATED | 1022 | 619 | All SZGR 2.0 genes in this pathway |
| MARSON BOUND BY FOXP3 UNSTIMULATED | 1229 | 713 | All SZGR 2.0 genes in this pathway |
| FIRESTEIN CTNNB1 PATHWAY | 33 | 23 | All SZGR 2.0 genes in this pathway |
| FIRESTEIN PROLIFERATION | 175 | 125 | All SZGR 2.0 genes in this pathway |