Gene Page: EDC3
Summary ?
| GeneID | 80153 |
| Symbol | EDC3 |
| Synonyms | LSM16|MRT50|YJDC|YJEFN2 |
| Description | enhancer of mRNA decapping 3 |
| Reference | MIM:609842|HGNC:HGNC:26114|Ensembl:ENSG00000179151|HPRD:07954|Vega:OTTHUMG00000142815 |
| Gene type | protein-coding |
| Map location | 15q24.1 |
| Pascal p-value | 0.66 |
| Sherlock p-value | 0.676 |
| Fetal beta | 0.629 |
| DMG | 1 (# studies) |
Gene in Data Sources
| Gene set name | Method of gene set | Description | Info |
|---|---|---|---|
| CV:PGCnp | Genome-wide Association Study | GWAS | |
| DMG:Jaffe_2016 | Genome-wide DNA methylation analysis | This dataset includes 2,104 probes/CpGs associated with SZ patients (n=108) compared to 136 controls at Bonferroni-adjusted P < 0.05. | 1 |
| Expression | Meta-analysis of gene expression | P value: 1.815 |
Section I. Genetics and epigenetics annotation
 Differentially methylated gene
| Probe | Chromosome | Position | Nearest gene | P (dis) | Beta (dis) | FDR (dis) | Study |
|---|---|---|---|---|---|---|---|
| cg10986864 | 15 | 74988803 | EDC3 | 1.66E-8 | -0.013 | 6.09E-6 | DMG:Jaffe_2016 |
Section II. Transcriptome annotation
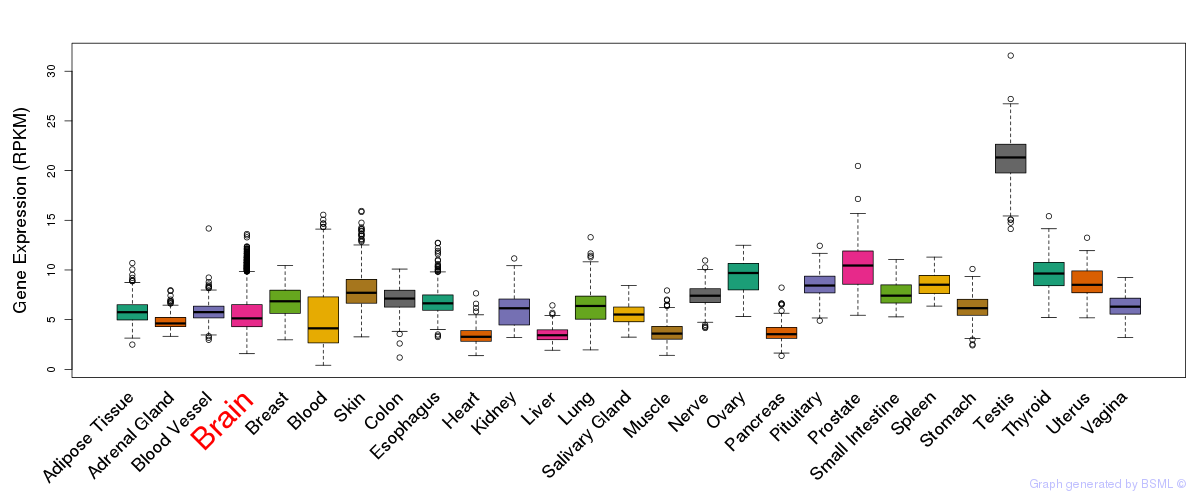
General gene expression (GTEx)
Gene expression during devlopment (BrainCloud)
Footnote:
A total of 269 time points ploted, with n=38 fetal samples (x=1:38). Each triangle represents one time point.
Gene expression of temporal and spatial changes (BrainSpan)
Footnote:
SC: sub-cortical regions; SM: sensory-motor regions; FC: frontal cortex; and TP: temporal-parietal cortex
ST1: fetal (13 - 26 postconception weeks), ST2: early infancy to late childhood (4 months to 11 years), and ST3: adolescence to adulthood (13 - 23 years)
The bar shown representes the lower 25% and upper 25% of the expression distribution.
Top co-expressed genes in brain regions
| Top 10 positively co-expressed genes | ||
| Gene | Pearson's Correlation | Spearman's Correlation |
| TRMT2A | 0.76 | 0.76 |
| ZFP41 | 0.75 | 0.77 |
| MZF1 | 0.74 | 0.74 |
| RFNG | 0.73 | 0.75 |
| PSMG4 | 0.73 | 0.70 |
| ARRDC1 | 0.72 | 0.71 |
| CHKB | 0.71 | 0.68 |
| NARFL | 0.71 | 0.70 |
| ADCK5 | 0.71 | 0.69 |
| CCDC130 | 0.71 | 0.71 |
| Top 10 negatively co-expressed genes | ||
| Gene | Pearson's Correlation | Spearman's Correlation |
| MT-ATP8 | -0.49 | -0.51 |
| AF347015.8 | -0.48 | -0.45 |
| AF347015.31 | -0.48 | -0.45 |
| MT-CYB | -0.47 | -0.45 |
| AF347015.27 | -0.47 | -0.45 |
| AF347015.2 | -0.46 | -0.43 |
| MT-CO2 | -0.46 | -0.43 |
| AF347015.15 | -0.46 | -0.43 |
| AF347015.21 | -0.45 | -0.48 |
| AL139819.3 | -0.45 | -0.46 |
Section III. Gene Ontology annotation
| Molecular function | GO term | Evidence | Neuro keywords | PubMed ID |
|---|---|---|---|---|
| GO:0005515 | protein binding | IPI | 16364915 |17353931 | |
| Cellular component | GO term | Evidence | Neuro keywords | PubMed ID |
| GO:0005737 | cytoplasm | IEA | - |
Section V. Pathway annotation
| Pathway name | Pathway size | # SZGR 2.0 genes in pathway | Info |
|---|---|---|---|
| KEGG RNA DEGRADATION | 59 | 37 | All SZGR 2.0 genes in this pathway |
| REACTOME MRNA DECAY BY 5 TO 3 EXORIBONUCLEASE | 15 | 10 | All SZGR 2.0 genes in this pathway |
| REACTOME METABOLISM OF MRNA | 284 | 128 | All SZGR 2.0 genes in this pathway |
| REACTOME DEADENYLATION DEPENDENT MRNA DECAY | 48 | 29 | All SZGR 2.0 genes in this pathway |
| REACTOME METABOLISM OF RNA | 330 | 155 | All SZGR 2.0 genes in this pathway |
| CASORELLI ACUTE PROMYELOCYTIC LEUKEMIA DN | 663 | 425 | All SZGR 2.0 genes in this pathway |
| XU GH1 AUTOCRINE TARGETS UP | 268 | 157 | All SZGR 2.0 genes in this pathway |
| IWANAGA CARCINOGENESIS BY KRAS PTEN DN | 353 | 226 | All SZGR 2.0 genes in this pathway |
| ROME INSULIN TARGETS IN MUSCLE DN | 204 | 114 | All SZGR 2.0 genes in this pathway |
| PURBEY TARGETS OF CTBP1 AND SATB1 DN | 180 | 116 | All SZGR 2.0 genes in this pathway |
| WAKABAYASHI ADIPOGENESIS PPARG RXRA BOUND 8D | 882 | 506 | All SZGR 2.0 genes in this pathway |
Section VI. microRNA annotation
| miRNA family | Target position | miRNA ID | miRNA seq | ||
|---|---|---|---|---|---|
| UTR start | UTR end | Match method | |||
| miR-124.1 | 55 | 61 | 1A | hsa-miR-124a | UUAAGGCACGCGGUGAAUGCCA |
| miR-22 | 285 | 291 | m8 | hsa-miR-22brain | AAGCUGCCAGUUGAAGAACUGU |
| miR-29 | 856 | 862 | m8 | hsa-miR-29aSZ | UAGCACCAUCUGAAAUCGGUU |
| hsa-miR-29bSZ | UAGCACCAUUUGAAAUCAGUGUU | ||||
| hsa-miR-29cSZ | UAGCACCAUUUGAAAUCGGU | ||||
| miR-30-5p | 271 | 278 | 1A,m8 | hsa-miR-30a-5p | UGUAAACAUCCUCGACUGGAAG |
| hsa-miR-30cbrain | UGUAAACAUCCUACACUCUCAGC | ||||
| hsa-miR-30dSZ | UGUAAACAUCCCCGACUGGAAG | ||||
| hsa-miR-30bSZ | UGUAAACAUCCUACACUCAGCU | ||||
| hsa-miR-30e-5p | UGUAAACAUCCUUGACUGGA | ||||
| hsa-miR-30a-5p | UGUAAACAUCCUCGACUGGAAG | ||||
| hsa-miR-30cbrain | UGUAAACAUCCUACACUCUCAGC | ||||
| hsa-miR-30dSZ | UGUAAACAUCCCCGACUGGAAG | ||||
| hsa-miR-30bSZ | UGUAAACAUCCUACACUCAGCU | ||||
| hsa-miR-30e-5p | UGUAAACAUCCUUGACUGGA | ||||
| miR-342 | 119 | 125 | 1A | hsa-miR-342brain | UCUCACACAGAAAUCGCACCCGUC |
- SZ: miRNAs which differentially expressed in brain cortex of schizophrenia patients comparing with control samples using microarray. Click here to see the list of SZ related miRNAs.
- Brain: miRNAs which are expressed in brain based on miRNA microarray expression studies. Click here to see the list of brain related miRNAs.