Gene Page: WDR82
Summary ?
| GeneID | 80335 |
| Symbol | WDR82 |
| Synonyms | MST107|MSTP107|PRO2730|PRO34047|SWD2|TMEM113|WDR82A |
| Description | WD repeat domain 82 |
| Reference | MIM:611059|HGNC:HGNC:28826|Ensembl:ENSG00000164091|HPRD:15183|Vega:OTTHUMG00000150391 |
| Gene type | protein-coding |
| Map location | 3p21.2 |
| Pascal p-value | 5.379E-4 |
| Sherlock p-value | 0.138 |
| Fetal beta | 0.74 |
| DMG | 1 (# studies) |
| eGene | Myers' cis & trans |
Gene in Data Sources
| Gene set name | Method of gene set | Description | Info |
|---|---|---|---|
| CV:PGCnp | Genome-wide Association Study | GWAS | |
| DMG:Wockner_2014 | Genome-wide DNA methylation analysis | This dataset includes 4641 differentially methylated probes corresponding to 2929 unique genes between schizophrenia patients (n=24) and controls (n=24). | 1 |
| LK:YES | Genome-wide Association Study | This data set included 99 genes mapped to the 22 regions. The 24 leading SNPs were also included in CV:Ripke_2013 |
Section I. Genetics and epigenetics annotation
 Differentially methylated gene
| Probe | Chromosome | Position | Nearest gene | P (dis) | Beta (dis) | FDR (dis) | Study |
|---|---|---|---|---|---|---|---|
| cg03435448 | 3 | 52310724 | WDR82 | 2.004E-4 | 0.329 | 0.035 | DMG:Wockner_2014 |
eQTL annotation
| SNP ID | Chromosome | Position | eGene | Gene Entrez ID | pvalue | qvalue | TSS distance | eQTL type |
|---|---|---|---|---|---|---|---|---|
| rs10751722 | chr1 | 27543522 | WDR82 | 80335 | 0.05 | trans |
Section II. Transcriptome annotation
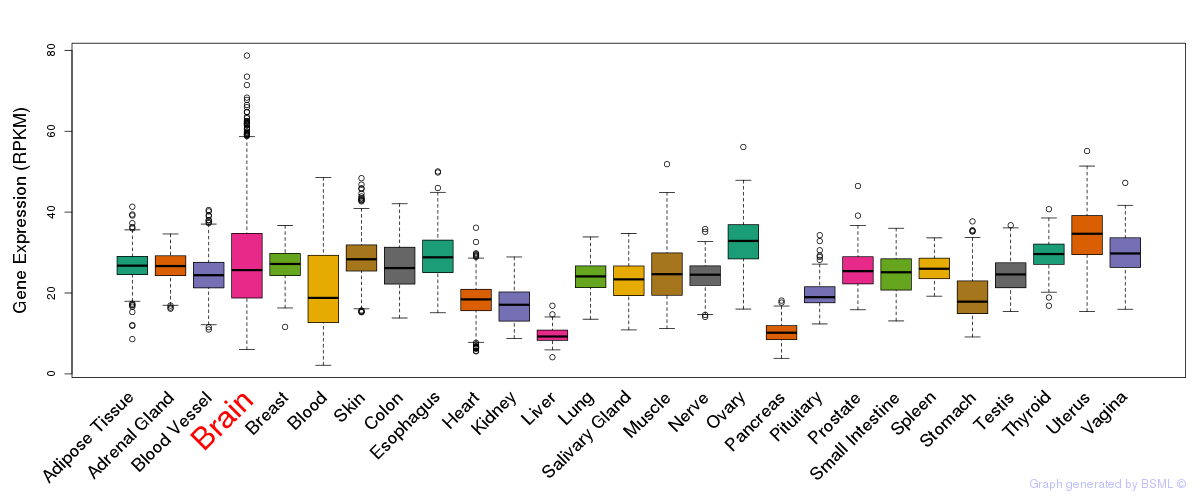
General gene expression (GTEx)
Gene expression during devlopment (BrainCloud)
Footnote:
A total of 269 time points ploted, with n=38 fetal samples (x=1:38). Each triangle represents one time point.
Gene expression of temporal and spatial changes (BrainSpan)
Footnote:
SC: sub-cortical regions; SM: sensory-motor regions; FC: frontal cortex; and TP: temporal-parietal cortex
ST1: fetal (13 - 26 postconception weeks), ST2: early infancy to late childhood (4 months to 11 years), and ST3: adolescence to adulthood (13 - 23 years)
The bar shown representes the lower 25% and upper 25% of the expression distribution.
Top co-expressed genes in brain regions
| Top 10 positively co-expressed genes | ||
| Gene | Pearson's Correlation | Spearman's Correlation |
| TMEM144 | 0.84 | 0.81 |
| CLDND1 | 0.84 | 0.69 |
| VAMP3 | 0.84 | 0.75 |
| CA2 | 0.83 | 0.79 |
| CPM | 0.83 | 0.82 |
| MOG | 0.83 | 0.81 |
| CLCA4 | 0.83 | 0.81 |
| PLP1 | 0.83 | 0.79 |
| MAP7 | 0.83 | 0.80 |
| PLA2G16 | 0.83 | 0.82 |
| Top 10 negatively co-expressed genes | ||
| Gene | Pearson's Correlation | Spearman's Correlation |
| NKIRAS2 | -0.56 | -0.58 |
| CBX8 | -0.55 | -0.63 |
| ZNF821 | -0.54 | -0.57 |
| C5orf13 | -0.54 | -0.59 |
| C17orf70 | -0.54 | -0.56 |
| DBN1 | -0.54 | -0.58 |
| SH3BP2 | -0.54 | -0.65 |
| TUBB2B | -0.54 | -0.63 |
| HMGB3 | -0.54 | -0.62 |
| ZNF695 | -0.54 | -0.59 |
Section V. Pathway annotation
| Pathway name | Pathway size | # SZGR 2.0 genes in pathway | Info |
|---|---|---|---|
| TIEN INTESTINE PROBIOTICS 24HR UP | 557 | 331 | All SZGR 2.0 genes in this pathway |
| GRAESSMANN APOPTOSIS BY DOXORUBICIN DN | 1781 | 1082 | All SZGR 2.0 genes in this pathway |
| GRAESSMANN RESPONSE TO MC AND DOXORUBICIN DN | 770 | 415 | All SZGR 2.0 genes in this pathway |
| LOPEZ MBD TARGETS | 957 | 597 | All SZGR 2.0 genes in this pathway |
| STARK PREFRONTAL CORTEX 22Q11 DELETION DN | 517 | 309 | All SZGR 2.0 genes in this pathway |
| RADMACHER AML PROGNOSIS | 78 | 52 | All SZGR 2.0 genes in this pathway |
| BROWNE HCMV INFECTION 16HR UP | 225 | 139 | All SZGR 2.0 genes in this pathway |
| DAZARD RESPONSE TO UV NHEK DN | 318 | 220 | All SZGR 2.0 genes in this pathway |
| BROWNE HCMV INFECTION 12HR UP | 111 | 68 | All SZGR 2.0 genes in this pathway |
| ROME INSULIN TARGETS IN MUSCLE UP | 442 | 263 | All SZGR 2.0 genes in this pathway |
| KASLER HDAC7 TARGETS 1 UP | 194 | 133 | All SZGR 2.0 genes in this pathway |
| WAKABAYASHI ADIPOGENESIS PPARG BOUND 8D | 658 | 397 | All SZGR 2.0 genes in this pathway |