Gene Page: PTDSS2
Summary ?
| GeneID | 81490 |
| Symbol | PTDSS2 |
| Synonyms | PSS2 |
| Description | phosphatidylserine synthase 2 |
| Reference | MIM:612793|HGNC:HGNC:15463|Ensembl:ENSG00000174915|HPRD:17927|Vega:OTTHUMG00000119087 |
| Gene type | protein-coding |
| Map location | 11p15.5 |
| Pascal p-value | 0.097 |
| Sherlock p-value | 0.989 |
| DMG | 1 (# studies) |
| eGene | Cerebellar Hemisphere Cerebellum |
Gene in Data Sources
| Gene set name | Method of gene set | Description | Info |
|---|---|---|---|
| CV:PGCnp | Genome-wide Association Study | GWAS | |
| DMG:Jaffe_2016 | Genome-wide DNA methylation analysis | This dataset includes 2,104 probes/CpGs associated with SZ patients (n=108) compared to 136 controls at Bonferroni-adjusted P < 0.05. | 1 |
Section I. Genetics and epigenetics annotation
 Differentially methylated gene
| Probe | Chromosome | Position | Nearest gene | P (dis) | Beta (dis) | FDR (dis) | Study |
|---|---|---|---|---|---|---|---|
| cg23260799 | 11 | 451101 | PTDSS2 | 1.5E-10 | -0.014 | 5E-7 | DMG:Jaffe_2016 |
Section II. Transcriptome annotation
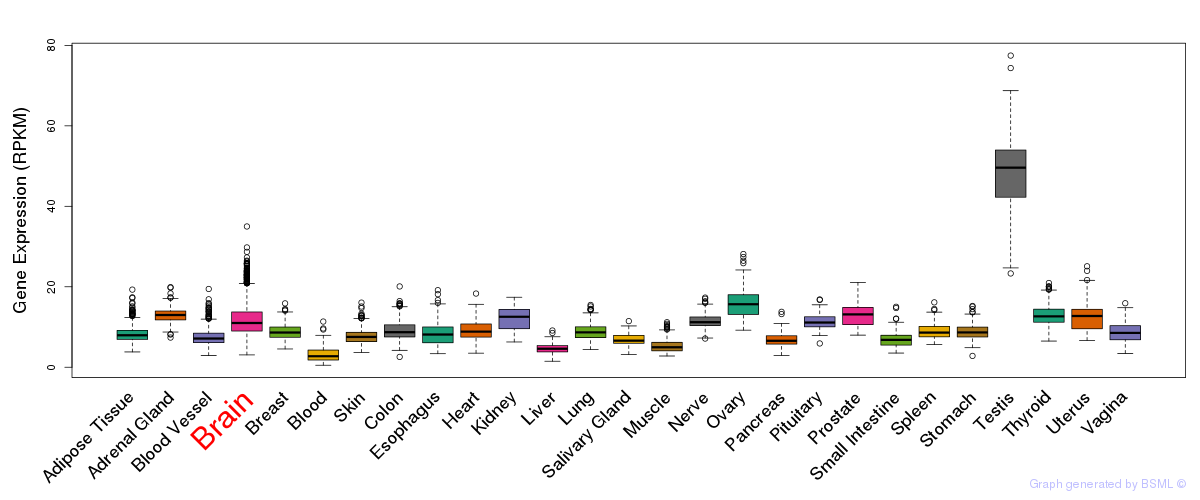
General gene expression (GTEx)
Gene expression of temporal and spatial changes (BrainSpan)
Footnote:
SC: sub-cortical regions; SM: sensory-motor regions; FC: frontal cortex; and TP: temporal-parietal cortex
ST1: fetal (13 - 26 postconception weeks), ST2: early infancy to late childhood (4 months to 11 years), and ST3: adolescence to adulthood (13 - 23 years)
The bar shown representes the lower 25% and upper 25% of the expression distribution.
Top co-expressed genes in brain regions
| Top 10 positively co-expressed genes | ||
| Gene | Pearson's Correlation | Spearman's Correlation |
| CHST6 | 0.77 | 0.76 |
| SASH1 | 0.77 | 0.77 |
| OTUD7B | 0.76 | 0.80 |
| AC022100.1 | 0.75 | 0.77 |
| PRIMA1 | 0.75 | 0.74 |
| PLEKHH1 | 0.74 | 0.75 |
| PRR5L | 0.74 | 0.76 |
| ITPKB | 0.73 | 0.76 |
| KIF13B | 0.73 | 0.77 |
| MYOM1 | 0.73 | 0.74 |
| Top 10 negatively co-expressed genes | ||
| Gene | Pearson's Correlation | Spearman's Correlation |
| COMMD3 | -0.42 | -0.50 |
| NR2C2AP | -0.41 | -0.49 |
| RPL31 | -0.41 | -0.60 |
| RPL27 | -0.40 | -0.61 |
| RPL35 | -0.40 | -0.58 |
| ZNF32 | -0.40 | -0.53 |
| RPS7 | -0.40 | -0.54 |
| RPL24 | -0.39 | -0.59 |
| RPS23 | -0.39 | -0.56 |
| RPS3AP47 | -0.39 | -0.56 |
Section V. Pathway annotation
| Pathway name | Pathway size | # SZGR 2.0 genes in pathway | Info |
|---|---|---|---|
| KEGG GLYCEROPHOSPHOLIPID METABOLISM | 77 | 35 | All SZGR 2.0 genes in this pathway |
| REACTOME PHOSPHOLIPID METABOLISM | 198 | 112 | All SZGR 2.0 genes in this pathway |
| REACTOME GLYCEROPHOSPHOLIPID BIOSYNTHESIS | 82 | 39 | All SZGR 2.0 genes in this pathway |
| REACTOME METABOLISM OF LIPIDS AND LIPOPROTEINS | 478 | 302 | All SZGR 2.0 genes in this pathway |
| TONKS TARGETS OF RUNX1 RUNX1T1 FUSION MONOCYTE UP | 204 | 140 | All SZGR 2.0 genes in this pathway |
| GRAESSMANN APOPTOSIS BY DOXORUBICIN DN | 1781 | 1082 | All SZGR 2.0 genes in this pathway |
| GRAESSMANN RESPONSE TO MC AND DOXORUBICIN DN | 770 | 415 | All SZGR 2.0 genes in this pathway |
| IVANOVA HEMATOPOIESIS MATURE CELL | 293 | 160 | All SZGR 2.0 genes in this pathway |
| BLALOCK ALZHEIMERS DISEASE UP | 1691 | 1088 | All SZGR 2.0 genes in this pathway |
| MOOTHA PGC | 420 | 269 | All SZGR 2.0 genes in this pathway |
| MILI PSEUDOPODIA HAPTOTAXIS DN | 668 | 419 | All SZGR 2.0 genes in this pathway |
| PILON KLF1 TARGETS UP | 504 | 321 | All SZGR 2.0 genes in this pathway |
| GOBERT CORE OLIGODENDROCYTE DIFFERENTIATION | 40 | 28 | All SZGR 2.0 genes in this pathway |
| VANOEVELEN MYOGENESIS SIN3A TARGETS | 220 | 133 | All SZGR 2.0 genes in this pathway |