Gene Page: ANKRD13C
Summary ?
| GeneID | 81573 |
| Symbol | ANKRD13C |
| Synonyms | dJ677H15.3 |
| Description | ankyrin repeat domain 13C |
| Reference | MIM:615125|HGNC:HGNC:25374|Ensembl:ENSG00000118454|HPRD:13176|Vega:OTTHUMG00000009343 |
| Gene type | protein-coding |
| Map location | 1p31.1 |
| Pascal p-value | 0.448 |
| Sherlock p-value | 0.532 |
| Fetal beta | 0.36 |
| DMG | 1 (# studies) |
Gene in Data Sources
| Gene set name | Method of gene set | Description | Info |
|---|---|---|---|
| CV:PGCnp | Genome-wide Association Study | GWAS | |
| DMG:Jaffe_2016 | Genome-wide DNA methylation analysis | This dataset includes 2,104 probes/CpGs associated with SZ patients (n=108) compared to 136 controls at Bonferroni-adjusted P < 0.05. | 2 |
| DMG:Wockner_2014 | Genome-wide DNA methylation analysis | This dataset includes 4641 differentially methylated probes corresponding to 2929 unique genes between schizophrenia patients (n=24) and controls (n=24). | 2 |
| GSMA_IIA | Genome scan meta-analysis (All samples) | Psr: 0.02692 |
Section I. Genetics and epigenetics annotation
 Differentially methylated gene
| Probe | Chromosome | Position | Nearest gene | P (dis) | Beta (dis) | FDR (dis) | Study |
|---|---|---|---|---|---|---|---|
| cg26220061 | 1 | 70819839 | HHLA3;ANKRD13C | 1.09E-4 | -0.268 | 0.028 | DMG:Wockner_2014 |
| cg09735905 | 1 | 70820197 | ANKRD13C | 5.47E-12 | -0.016 | 1.78E-7 | DMG:Jaffe_2016 |
Section II. Transcriptome annotation
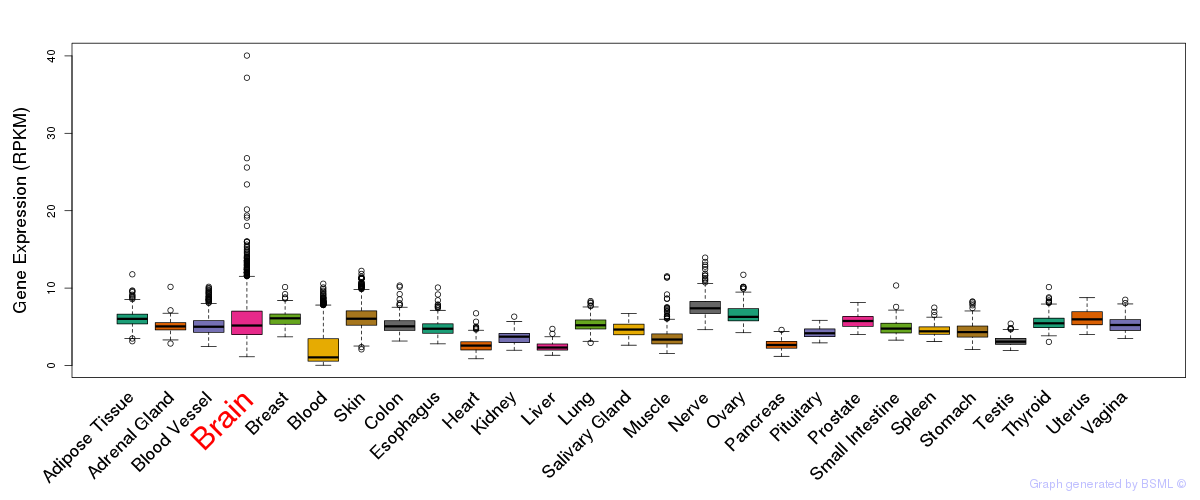
General gene expression (GTEx)
Gene expression during devlopment (BrainCloud)
Footnote:
A total of 269 time points ploted, with n=38 fetal samples (x=1:38). Each triangle represents one time point.
Gene expression of temporal and spatial changes (BrainSpan)
Footnote:
SC: sub-cortical regions; SM: sensory-motor regions; FC: frontal cortex; and TP: temporal-parietal cortex
ST1: fetal (13 - 26 postconception weeks), ST2: early infancy to late childhood (4 months to 11 years), and ST3: adolescence to adulthood (13 - 23 years)
The bar shown representes the lower 25% and upper 25% of the expression distribution.
No co-expressed genes in brain regions
Section III. Gene Ontology annotation
| Cellular component | GO term | Evidence | Neuro keywords | PubMed ID |
|---|---|---|---|---|
| GO:0005783 | endoplasmic reticulum | IDA | 11256614 |
Section V. Pathway annotation
| Pathway name | Pathway size | # SZGR 2.0 genes in pathway | Info |
|---|---|---|---|
| KINSEY TARGETS OF EWSR1 FLII FUSION UP | 1278 | 748 | All SZGR 2.0 genes in this pathway |
| LASTOWSKA NEUROBLASTOMA COPY NUMBER DN | 800 | 473 | All SZGR 2.0 genes in this pathway |
| BENPORATH EED TARGETS | 1062 | 725 | All SZGR 2.0 genes in this pathway |
| CHESLER BRAIN HIGHEST EXPRESSION | 40 | 29 | All SZGR 2.0 genes in this pathway |
| MARSON BOUND BY FOXP3 UNSTIMULATED | 1229 | 713 | All SZGR 2.0 genes in this pathway |
| MILI PSEUDOPODIA HAPTOTAXIS UP | 518 | 299 | All SZGR 2.0 genes in this pathway |
| PYEON CANCER HEAD AND NECK VS CERVICAL UP | 193 | 95 | All SZGR 2.0 genes in this pathway |
| JOHNSTONE PARVB TARGETS 2 DN | 336 | 211 | All SZGR 2.0 genes in this pathway |
| PURBEY TARGETS OF CTBP1 NOT SATB1 DN | 448 | 282 | All SZGR 2.0 genes in this pathway |
| YANG BCL3 TARGETS UP | 364 | 236 | All SZGR 2.0 genes in this pathway |
Section VI. microRNA annotation
| miRNA family | Target position | miRNA ID | miRNA seq | ||
|---|---|---|---|---|---|
| UTR start | UTR end | Match method | |||
| miR-122 | 366 | 372 | m8 | hsa-miR-122a | UGGAGUGUGACAAUGGUGUUUGU |
| miR-17-5p/20/93.mr/106/519.d | 844 | 851 | 1A,m8 | hsa-miR-17-5p | CAAAGUGCUUACAGUGCAGGUAGU |
| hsa-miR-20abrain | UAAAGUGCUUAUAGUGCAGGUAG | ||||
| hsa-miR-106a | AAAAGUGCUUACAGUGCAGGUAGC | ||||
| hsa-miR-106bSZ | UAAAGUGCUGACAGUGCAGAU | ||||
| hsa-miR-20bSZ | CAAAGUGCUCAUAGUGCAGGUAG | ||||
| hsa-miR-519d | CAAAGUGCCUCCCUUUAGAGUGU | ||||
| miR-181 | 521 | 527 | m8 | hsa-miR-181abrain | AACAUUCAACGCUGUCGGUGAGU |
| hsa-miR-181bSZ | AACAUUCAUUGCUGUCGGUGGG | ||||
| hsa-miR-181cbrain | AACAUUCAACCUGUCGGUGAGU | ||||
| hsa-miR-181dbrain | AACAUUCAUUGUUGUCGGUGGGUU | ||||
| miR-183 | 182 | 188 | m8 | hsa-miR-183 | UAUGGCACUGGUAGAAUUCACUG |
| miR-208 | 396 | 402 | 1A | hsa-miR-208 | AUAAGACGAGCAAAAAGCUUGU |
| miR-25/32/92/363/367 | 615 | 621 | 1A | hsa-miR-25brain | CAUUGCACUUGUCUCGGUCUGA |
| hsa-miR-32 | UAUUGCACAUUACUAAGUUGC | ||||
| hsa-miR-92 | UAUUGCACUUGUCCCGGCCUG | ||||
| hsa-miR-367 | AAUUGCACUUUAGCAAUGGUGA | ||||
| hsa-miR-92bSZ | UAUUGCACUCGUCCCGGCCUC | ||||
| miR-29 | 691 | 698 | 1A,m8 | hsa-miR-29aSZ | UAGCACCAUCUGAAAUCGGUU |
| hsa-miR-29bSZ | UAGCACCAUUUGAAAUCAGUGUU | ||||
| hsa-miR-29cSZ | UAGCACCAUUUGAAAUCGGU | ||||
| miR-495 | 716 | 723 | 1A,m8 | hsa-miR-495brain | AAACAAACAUGGUGCACUUCUUU |
| miR-499 | 396 | 402 | 1A | hsa-miR-499 | UUAAGACUUGCAGUGAUGUUUAA |
| miR-505 | 314 | 320 | 1A | hsa-miR-505 | GUCAACACUUGCUGGUUUCCUC |
| miR-543 | 522 | 528 | m8 | hsa-miR-543 | AAACAUUCGCGGUGCACUUCU |
| miR-93.hd/291-3p/294/295/302/372/373/520 | 843 | 849 | m8 | hsa-miR-93brain | AAAGUGCUGUUCGUGCAGGUAG |
| hsa-miR-302a | UAAGUGCUUCCAUGUUUUGGUGA | ||||
| hsa-miR-302b | UAAGUGCUUCCAUGUUUUAGUAG | ||||
| hsa-miR-302c | UAAGUGCUUCCAUGUUUCAGUGG | ||||
| hsa-miR-302d | UAAGUGCUUCCAUGUUUGAGUGU | ||||
| hsa-miR-372 | AAAGUGCUGCGACAUUUGAGCGU | ||||
| hsa-miR-373 | GAAGUGCUUCGAUUUUGGGGUGU | ||||
| hsa-miR-520e | AAAGUGCUUCCUUUUUGAGGG | ||||
| hsa-miR-520a | AAAGUGCUUCCCUUUGGACUGU | ||||
| hsa-miR-520b | AAAGUGCUUCCUUUUAGAGGG | ||||
| hsa-miR-520c | AAAGUGCUUCCUUUUAGAGGGUU | ||||
| hsa-miR-520d | AAAGUGCUUCUCUUUGGUGGGUU | ||||
- SZ: miRNAs which differentially expressed in brain cortex of schizophrenia patients comparing with control samples using microarray. Click here to see the list of SZ related miRNAs.
- Brain: miRNAs which are expressed in brain based on miRNA microarray expression studies. Click here to see the list of brain related miRNAs.