Gene Page: TMEM14B
Summary ?
| GeneID | 81853 |
| Symbol | TMEM14B |
| Synonyms | - |
| Description | transmembrane protein 14B |
| Reference | HGNC:HGNC:21384|Ensembl:ENSG00000137210|HPRD:15523|Vega:OTTHUMG00000014246 |
| Gene type | protein-coding |
| Map location | 6p25.1-p23 |
| Sherlock p-value | 0.785 |
| Fetal beta | -0.316 |
| DMG | 2 (# studies) |
| eGene | Myers' cis & trans |
Gene in Data Sources
| Gene set name | Method of gene set | Description | Info |
|---|---|---|---|
| CV:PGCnp | Genome-wide Association Study | GWAS | |
| DMG:Jaffe_2016 | Genome-wide DNA methylation analysis | This dataset includes 2,104 probes/CpGs associated with SZ patients (n=108) compared to 136 controls at Bonferroni-adjusted P < 0.05. | 2 |
| DMG:Nishioka_2013 | Genome-wide DNA methylation analysis | The authors investigated the methylation profiles of DNA in peripheral blood cells from 18 patients with first-episode schizophrenia (FESZ) and from 15 normal controls. | 2 |
| GSMA_I | Genome scan meta-analysis | Psr: 0.0159 |
Section I. Genetics and epigenetics annotation
 Differentially methylated gene
| Probe | Chromosome | Position | Nearest gene | P (dis) | Beta (dis) | FDR (dis) | Study |
|---|---|---|---|---|---|---|---|
| cg21486659 | 6 | 10747693 | TMEM14B | -0.025 | 0.27 | DMG:Nishioka_2013 | |
| cg08552121 | 6 | 10748352 | TMEM14B | 3E-8 | -0.029 | 9.21E-6 | DMG:Jaffe_2016 |
eQTL annotation
| SNP ID | Chromosome | Position | eGene | Gene Entrez ID | pvalue | qvalue | TSS distance | eQTL type |
|---|---|---|---|---|---|---|---|---|
| rs1503026 | chr18 | 70842605 | TMEM14B | 81853 | 0.03 | trans | ||
| rs12326929 | chr18 | 70864592 | TMEM14B | 81853 | 0.07 | trans |
Section II. Transcriptome annotation
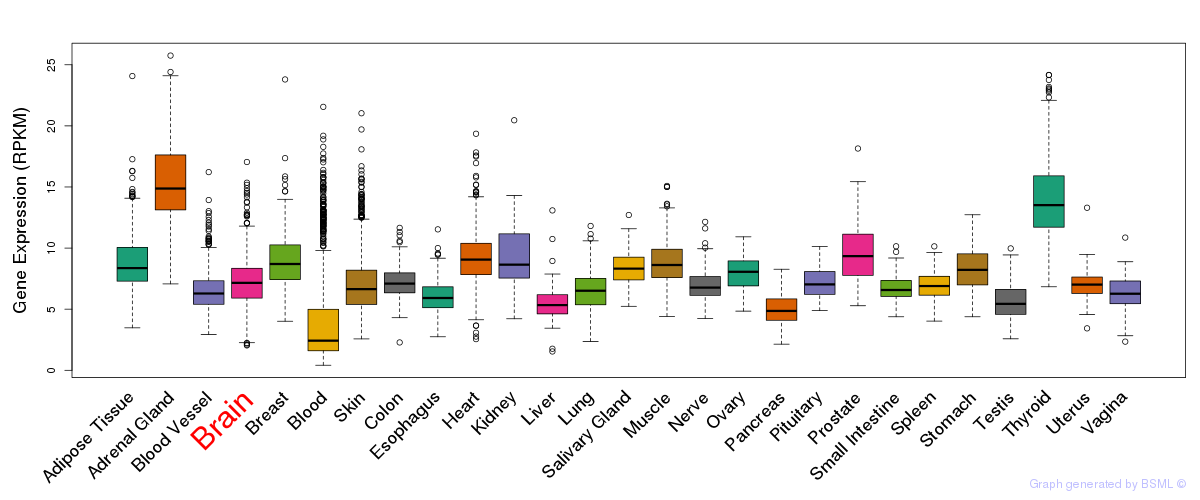
General gene expression (GTEx)
Gene expression during devlopment (BrainCloud)
Footnote:
A total of 269 time points ploted, with n=38 fetal samples (x=1:38). Each triangle represents one time point.
Gene expression of temporal and spatial changes (BrainSpan)
Footnote:
SC: sub-cortical regions; SM: sensory-motor regions; FC: frontal cortex; and TP: temporal-parietal cortex
ST1: fetal (13 - 26 postconception weeks), ST2: early infancy to late childhood (4 months to 11 years), and ST3: adolescence to adulthood (13 - 23 years)
The bar shown representes the lower 25% and upper 25% of the expression distribution.
No co-expressed genes in brain regions
Section III. Gene Ontology annotation
| Cellular component | GO term | Evidence | Neuro keywords | PubMed ID |
|---|---|---|---|---|
| GO:0016020 | membrane | IEA | - | |
| GO:0016021 | integral to membrane | IEA | - |
Section V. Pathway annotation
| Pathway name | Pathway size | # SZGR 2.0 genes in pathway | Info |
|---|---|---|---|
| FULCHER INFLAMMATORY RESPONSE LECTIN VS LPS UP | 579 | 346 | All SZGR 2.0 genes in this pathway |
| KIM WT1 TARGETS 8HR DN | 129 | 84 | All SZGR 2.0 genes in this pathway |
| SHEN SMARCA2 TARGETS UP | 424 | 268 | All SZGR 2.0 genes in this pathway |
| WANG SMARCE1 TARGETS DN | 371 | 218 | All SZGR 2.0 genes in this pathway |
| ACEVEDO LIVER CANCER UP | 973 | 570 | All SZGR 2.0 genes in this pathway |
| FONTAINE FOLLICULAR THYROID ADENOMA DN | 68 | 45 | All SZGR 2.0 genes in this pathway |
| JOHNSTONE PARVB TARGETS 2 DN | 336 | 211 | All SZGR 2.0 genes in this pathway |