Gene Page: TAS1R3
Summary ?
| GeneID | 83756 |
| Symbol | TAS1R3 |
| Synonyms | T1R3 |
| Description | taste 1 receptor member 3 |
| Reference | MIM:605865|HGNC:HGNC:15661| |
| Gene type | protein-coding |
| Map location | 1p36.33 |
| Pascal p-value | 0.564 |
| Fetal beta | -0.195 |
| DMG | 1 (# studies) |
Gene in Data Sources
| Gene set name | Method of gene set | Description | Info |
|---|---|---|---|
| CV:PGCnp | Genome-wide Association Study | GWAS | |
| DMG:Wockner_2014 | Genome-wide DNA methylation analysis | This dataset includes 4641 differentially methylated probes corresponding to 2929 unique genes between schizophrenia patients (n=24) and controls (n=24). | 1 |
| GO_Annotation | Mapping neuro-related keywords to Gene Ontology annotations | Hits with neuro-related keywords: 1 |
Section I. Genetics and epigenetics annotation
 Differentially methylated gene
| Probe | Chromosome | Position | Nearest gene | P (dis) | Beta (dis) | FDR (dis) | Study |
|---|---|---|---|---|---|---|---|
| cg21396988 | 1 | 1267201 | TAS1R3 | 5.83E-4 | 0.396 | 0.049 | DMG:Wockner_2014 |
Section II. Transcriptome annotation
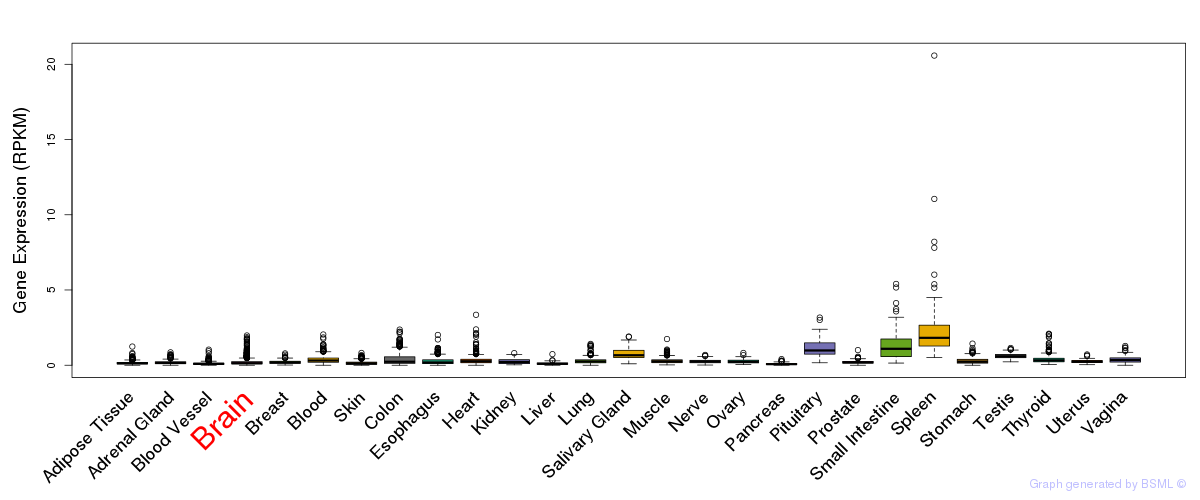
General gene expression (GTEx)

Gene expression during devlopment (BrainCloud)
Footnote:
A total of 269 time points ploted, with n=38 fetal samples (x=1:38). Each triangle represents one time point.
Gene expression of temporal and spatial changes (BrainSpan)
Footnote:
SC: sub-cortical regions; SM: sensory-motor regions; FC: frontal cortex; and TP: temporal-parietal cortex
ST1: fetal (13 - 26 postconception weeks), ST2: early infancy to late childhood (4 months to 11 years), and ST3: adolescence to adulthood (13 - 23 years)
The bar shown representes the lower 25% and upper 25% of the expression distribution.
No co-expressed genes in brain regions
Section III. Gene Ontology annotation
| Molecular function | GO term | Evidence | Neuro keywords | PubMed ID |
|---|---|---|---|---|
| GO:0004872 | receptor activity | IEA | - | |
| GO:0004930 | G-protein coupled receptor activity | IEA | - | |
| GO:0033041 | sweet taste receptor activity | IDA | 16720576 | |
| GO:0046982 | protein heterodimerization activity | NAS | 11917125 | |
| Biological process | GO term | Evidence | Neuro keywords | PubMed ID |
| GO:0050917 | sensory perception of umami taste | IDA | glutamate (GO term level: 9) | 11917125 |
| GO:0001582 | detection of chemical stimulus involved in sensory perception of sweet taste | IDA | 16720576 | |
| GO:0007186 | G-protein coupled receptor protein signaling pathway | IC | 16720576 | |
| GO:0007165 | signal transduction | IEA | - | |
| GO:0050896 | response to stimulus | IEA | - | |
| Cellular component | GO term | Evidence | Neuro keywords | PubMed ID |
| GO:0016021 | integral to membrane | IC | 11917125 | |
| GO:0005886 | plasma membrane | IEA | - |
Section V. Pathway annotation
| Pathway name | Pathway size | # SZGR 2.0 genes in pathway | Info |
|---|---|---|---|
| KEGG TASTE TRANSDUCTION | 52 | 28 | All SZGR 2.0 genes in this pathway |
| REACTOME SIGNALING BY GPCR | 920 | 449 | All SZGR 2.0 genes in this pathway |
| REACTOME CLASS C 3 METABOTROPIC GLUTAMATE PHEROMONE RECEPTORS | 15 | 11 | All SZGR 2.0 genes in this pathway |
| REACTOME GPCR LIGAND BINDING | 408 | 246 | All SZGR 2.0 genes in this pathway |
| PENG GLUTAMINE DEPRIVATION UP | 38 | 25 | All SZGR 2.0 genes in this pathway |
| NING CHRONIC OBSTRUCTIVE PULMONARY DISEASE UP | 157 | 105 | All SZGR 2.0 genes in this pathway |
| PENG RAPAMYCIN RESPONSE UP | 203 | 130 | All SZGR 2.0 genes in this pathway |
| YAUCH HEDGEHOG SIGNALING PARACRINE DN | 264 | 159 | All SZGR 2.0 genes in this pathway |