Gene Page: C10orf11
Summary ?
| GeneID | 83938 |
| Symbol | C10orf11 |
| Synonyms | CDA017 |
| Description | chromosome 10 open reading frame 11 |
| Reference | MIM:614537|HGNC:HGNC:23405|Ensembl:ENSG00000148655|HPRD:12560|Vega:OTTHUMG00000018532 |
| Gene type | protein-coding |
| Map location | 10q22.3 |
| Pascal p-value | 0.023 |
| Fetal beta | -1.002 |
| eGene | Anterior cingulate cortex BA24 Caudate basal ganglia Cortex Frontal Cortex BA9 Meta |
Gene in Data Sources
| Gene set name | Method of gene set | Description | Info |
|---|---|---|---|
| CV:GWASdb | Genome-wide Association Studies | GWASdb records for schizophrenia | |
| CV:PGCnp | Genome-wide Association Study | GWAS | |
| CV:PheWAS | Phenome-wide association studies (PheWAS) | 157 SNPs associated with schizophrenia | 1 |
Section I. Genetics and epigenetics annotation
 CV:PheWAS
| SNP ID | Chromosome | Position | Allele | P | Function | Gene | Up/Down Distance |
|---|---|---|---|---|---|---|---|
| rs11001819 | 10 | 0 | null | 1.567 | C10orf11 | null |
eQTL annotation
| SNP ID | Chromosome | Position | eGene | Gene Entrez ID | pvalue | qvalue | TSS distance | eQTL type |
|---|---|---|---|---|---|---|---|---|
| rs17465899 | 10 | 78203215 | C10orf11 | ENSG00000148655.10 | 1.769E-6 | 0.02 | 842217 | gtex_brain_ba24 |
| rs4745814 | 10 | 78204376 | C10orf11 | ENSG00000148655.10 | 4.274E-6 | 0.02 | 843378 | gtex_brain_ba24 |
| rs11001787 | 10 | 78221963 | C10orf11 | ENSG00000148655.10 | 1.306E-6 | 0.02 | 860965 | gtex_brain_ba24 |
| rs11001789 | 10 | 78226239 | C10orf11 | ENSG00000148655.10 | 2.993E-6 | 0.02 | 865241 | gtex_brain_ba24 |
| rs11492301 | 10 | 78235043 | C10orf11 | ENSG00000148655.10 | 3.01E-6 | 0.02 | 874045 | gtex_brain_ba24 |
| rs17381773 | 10 | 78238872 | C10orf11 | ENSG00000148655.10 | 3.028E-6 | 0.02 | 877874 | gtex_brain_ba24 |
| rs56233427 | 10 | 78242576 | C10orf11 | ENSG00000148655.10 | 4.202E-6 | 0.02 | 881578 | gtex_brain_ba24 |
| rs1907331 | 10 | 78244948 | C10orf11 | ENSG00000148655.10 | 1.011E-6 | 0.02 | 883950 | gtex_brain_ba24 |
| rs11510981 | 10 | 78250153 | C10orf11 | ENSG00000148655.10 | 2.163E-6 | 0.02 | 889155 | gtex_brain_ba24 |
| rs11001799 | 10 | 78252554 | C10orf11 | ENSG00000148655.10 | 1.012E-6 | 0.02 | 891556 | gtex_brain_ba24 |
| rs55831937 | 10 | 78263947 | C10orf11 | ENSG00000148655.10 | 4.275E-6 | 0.02 | 902949 | gtex_brain_ba24 |
| rs10824419 | 10 | 78268635 | C10orf11 | ENSG00000148655.10 | 3.713E-6 | 0.02 | 907637 | gtex_brain_ba24 |
| rs11001803 | 10 | 78269701 | C10orf11 | ENSG00000148655.10 | 1.569E-6 | 0.02 | 908703 | gtex_brain_ba24 |
| rs1907322 | 10 | 78272249 | C10orf11 | ENSG00000148655.10 | 4.327E-6 | 0.02 | 911251 | gtex_brain_ba24 |
| rs6480819 | 10 | 78276753 | C10orf11 | ENSG00000148655.10 | 1.477E-6 | 0.02 | 915755 | gtex_brain_ba24 |
| rs7917297 | 10 | 78281181 | C10orf11 | ENSG00000148655.10 | 3.917E-6 | 0.02 | 920183 | gtex_brain_ba24 |
| rs61866937 | 10 | 78284347 | C10orf11 | ENSG00000148655.10 | 3.935E-6 | 0.02 | 923349 | gtex_brain_ba24 |
| rs11001805 | 10 | 78286474 | C10orf11 | ENSG00000148655.10 | 2.346E-6 | 0.02 | 925476 | gtex_brain_ba24 |
| rs2220608 | 10 | 78292356 | C10orf11 | ENSG00000148655.10 | 3.874E-6 | 0.02 | 931358 | gtex_brain_ba24 |
| rs11001807 | 10 | 78292989 | C10orf11 | ENSG00000148655.10 | 3.877E-6 | 0.02 | 931991 | gtex_brain_ba24 |
| rs1907308 | 10 | 78299651 | C10orf11 | ENSG00000148655.10 | 1.262E-6 | 0.02 | 938653 | gtex_brain_ba24 |
| rs2395383 | 10 | 78300806 | C10orf11 | ENSG00000148655.10 | 2.46E-6 | 0.02 | 939808 | gtex_brain_ba24 |
| rs11001814 | 10 | 78301155 | C10orf11 | ENSG00000148655.10 | 1.86E-6 | 0.02 | 940157 | gtex_brain_ba24 |
| rs7071653 | 10 | 78301616 | C10orf11 | ENSG00000148655.10 | 4.435E-6 | 0.02 | 940618 | gtex_brain_ba24 |
| rs7072009 | 10 | 78301652 | C10orf11 | ENSG00000148655.10 | 3.594E-6 | 0.02 | 940654 | gtex_brain_ba24 |
Section II. Transcriptome annotation
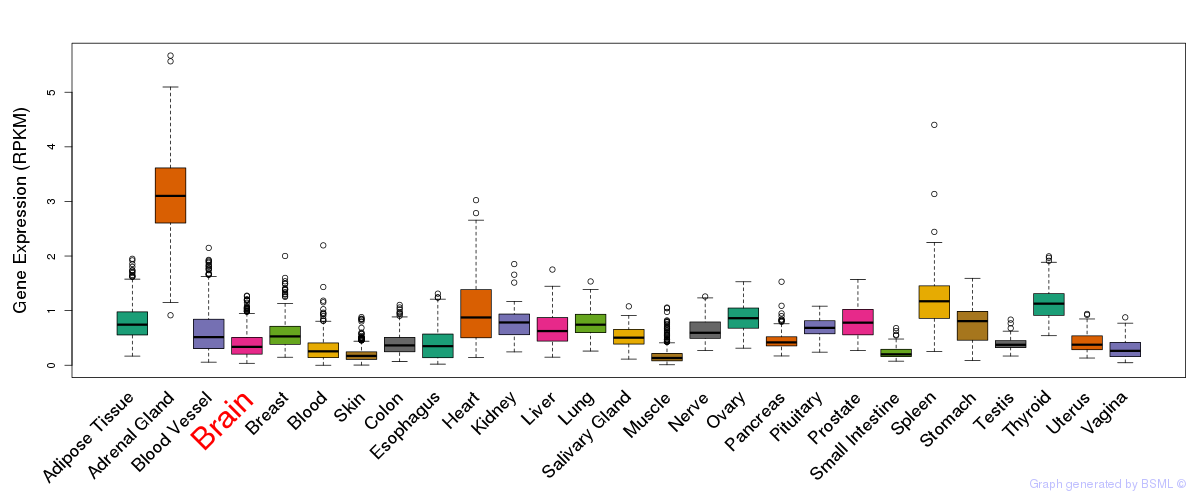
General gene expression (GTEx)
Gene expression during devlopment (BrainCloud)
Footnote:
A total of 269 time points ploted, with n=38 fetal samples (x=1:38). Each triangle represents one time point.
Gene expression of temporal and spatial changes (BrainSpan)
Footnote:
SC: sub-cortical regions; SM: sensory-motor regions; FC: frontal cortex; and TP: temporal-parietal cortex
ST1: fetal (13 - 26 postconception weeks), ST2: early infancy to late childhood (4 months to 11 years), and ST3: adolescence to adulthood (13 - 23 years)
The bar shown representes the lower 25% and upper 25% of the expression distribution.
No co-expressed genes in brain regions
Section V. Pathway annotation
| Pathway name | Pathway size | # SZGR 2.0 genes in pathway | Info |
|---|---|---|---|
| SANCHEZ MDM2 TARGETS | 15 | 10 | All SZGR 2.0 genes in this pathway |
| INGRAM SHH TARGETS UP | 127 | 79 | All SZGR 2.0 genes in this pathway |
| KIM GERMINAL CENTER T HELPER DN | 24 | 15 | All SZGR 2.0 genes in this pathway |
| MOREAUX MULTIPLE MYELOMA BY TACI UP | 412 | 249 | All SZGR 2.0 genes in this pathway |
| MOREAUX B LYMPHOCYTE MATURATION BY TACI UP | 92 | 58 | All SZGR 2.0 genes in this pathway |
| CUI TCF21 TARGETS 2 DN | 830 | 547 | All SZGR 2.0 genes in this pathway |
| GYORFFY MITOXANTRONE RESISTANCE | 57 | 35 | All SZGR 2.0 genes in this pathway |
| CHANDRAN METASTASIS DN | 306 | 191 | All SZGR 2.0 genes in this pathway |
| WANG RESPONSE TO GSK3 INHIBITOR SB216763 UP | 397 | 206 | All SZGR 2.0 genes in this pathway |
| TORCHIA TARGETS OF EWSR1 FLI1 FUSION DN | 321 | 200 | All SZGR 2.0 genes in this pathway |