Gene Page: CARD6
Summary ?
| GeneID | 84674 |
| Symbol | CARD6 |
| Synonyms | CINCIN1 |
| Description | caspase recruitment domain family member 6 |
| Reference | MIM:609986|HGNC:HGNC:16394|Ensembl:ENSG00000132357|HPRD:09871|Vega:OTTHUMG00000094775 |
| Gene type | protein-coding |
| Map location | 5p13.1 |
| Pascal p-value | 0.498 |
| Fetal beta | -0.23 |
| eGene | Myers' cis & trans |
| Support | CompositeSet |
Gene in Data Sources
| Gene set name | Method of gene set | Description | Info |
|---|---|---|---|
| CV:PGCnp | Genome-wide Association Study | GWAS | |
| DNM:Xu_2012 | Whole Exome Sequencing analysis | De novo mutations of 4 genes were identified by exome sequencing of 795 samples in this study |
Section I. Genetics and epigenetics annotation
 DNM table
| Gene | Chromosome | Position | Ref | Alt | Transcript | AA change | Mutation type | Sift | CG46 | Trait | Study |
|---|---|---|---|---|---|---|---|---|---|---|---|
| CARD6 | chr5 | 40852724 | G | C | NM_032587 | p.430K>N | missense | Schizophrenia | DNM:Xu_2012 |
eQTL annotation
| SNP ID | Chromosome | Position | eGene | Gene Entrez ID | pvalue | qvalue | TSS distance | eQTL type |
|---|---|---|---|---|---|---|---|---|
| rs10994209 | chr10 | 61877705 | CARD6 | 84674 | 0.14 | trans |
Section II. Transcriptome annotation
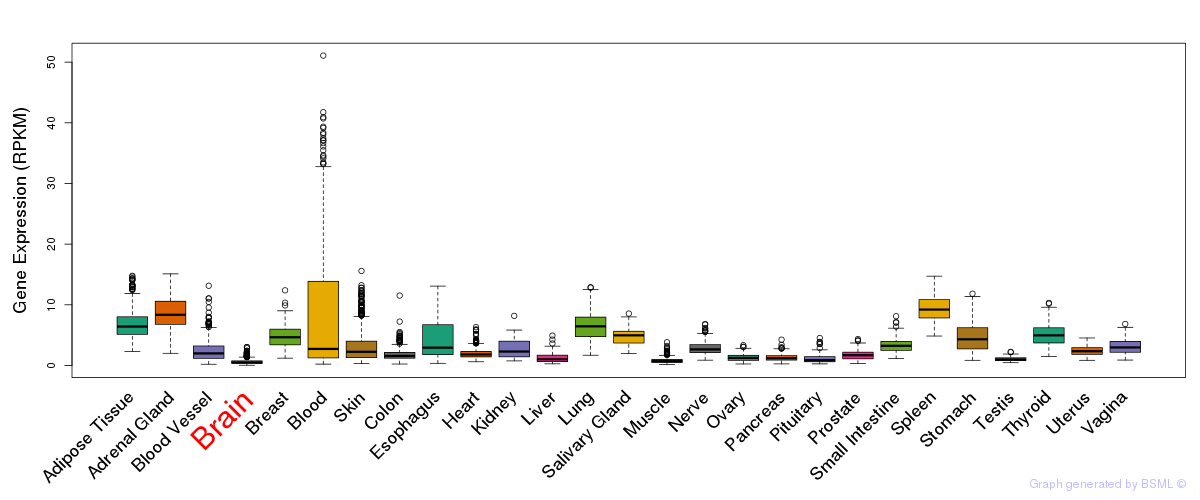
General gene expression (GTEx)
Gene expression during devlopment (BrainCloud)
Footnote:
A total of 269 time points ploted, with n=38 fetal samples (x=1:38). Each triangle represents one time point.
Gene expression of temporal and spatial changes (BrainSpan)
Footnote:
SC: sub-cortical regions; SM: sensory-motor regions; FC: frontal cortex; and TP: temporal-parietal cortex
ST1: fetal (13 - 26 postconception weeks), ST2: early infancy to late childhood (4 months to 11 years), and ST3: adolescence to adulthood (13 - 23 years)
The bar shown representes the lower 25% and upper 25% of the expression distribution.
No co-expressed genes in brain regions
Section V. Pathway annotation
| Pathway name | Pathway size | # SZGR 2.0 genes in pathway | Info |
|---|---|---|---|
| KEGG NOD LIKE RECEPTOR SIGNALING PATHWAY | 62 | 47 | All SZGR 2.0 genes in this pathway |
| NAKAMURA TUMOR ZONE PERIPHERAL VS CENTRAL DN | 634 | 384 | All SZGR 2.0 genes in this pathway |
| CHARAFE BREAST CANCER LUMINAL VS BASAL DN | 455 | 304 | All SZGR 2.0 genes in this pathway |
| KINSEY TARGETS OF EWSR1 FLII FUSION DN | 329 | 219 | All SZGR 2.0 genes in this pathway |
| RICKMAN TUMOR DIFFERENTIATED WELL VS POORLY DN | 382 | 224 | All SZGR 2.0 genes in this pathway |
| RICKMAN TUMOR DIFFERENTIATED MODERATELY VS POORLY UP | 121 | 71 | All SZGR 2.0 genes in this pathway |
| GOTTWEIN TARGETS OF KSHV MIR K12 11 | 63 | 45 | All SZGR 2.0 genes in this pathway |
| MARZEC IL2 SIGNALING DN | 36 | 24 | All SZGR 2.0 genes in this pathway |
| CHIANG LIVER CANCER SUBCLASS POLYSOMY7 DN | 24 | 17 | All SZGR 2.0 genes in this pathway |
| ZWANG TRANSIENTLY UP BY 1ST EGF PULSE ONLY | 1839 | 928 | All SZGR 2.0 genes in this pathway |