Gene Page: KIAA1671
Summary ?
| GeneID | 85379 |
| Symbol | KIAA1671 |
| Synonyms | - |
| Description | KIAA1671 |
| Reference | HGNC:HGNC:29345|Ensembl:ENSG00000197077| |
| Gene type | protein-coding |
| Map location | 22q11.23 |
| Pascal p-value | 0.005 |
| Fetal beta | -2.272 |
| DMG | 1 (# studies) |
| eGene | Anterior cingulate cortex BA24 Meta |
| Support | Ascano FMRP targets |
Gene in Data Sources
| Gene set name | Method of gene set | Description | Info |
|---|---|---|---|
| CV:GWASdb | Genome-wide Association Studies | GWASdb records for schizophrenia | |
| CV:PGCnp | Genome-wide Association Study | GWAS | |
| DMG:Wockner_2014 | Genome-wide DNA methylation analysis | This dataset includes 4641 differentially methylated probes corresponding to 2929 unique genes between schizophrenia patients (n=24) and controls (n=24). | 1 |
Section I. Genetics and epigenetics annotation
 Differentially methylated gene
| Probe | Chromosome | Position | Nearest gene | P (dis) | Beta (dis) | FDR (dis) | Study |
|---|---|---|---|---|---|---|---|
| cg08820568 | 22 | 25423974 | KIAA1671 | 2.451E-4 | 0.447 | 0.037 | DMG:Wockner_2014 |
 eQTL annotation
| SNP ID | Chromosome | Position | eGene | Gene Entrez ID | pvalue | qvalue | TSS distance | eQTL type |
|---|---|---|---|---|---|---|---|---|
| rs9624717 | 22 | 25467431 | KIAA1671 | ENSG00000197077.8 | 7.48379E-7 | 0.02 | 118734 | gtex_brain_ba24 |
| rs738324 | 22 | 25468432 | KIAA1671 | ENSG00000197077.8 | 7.57315E-7 | 0.02 | 119735 | gtex_brain_ba24 |
| rs713961 | 22 | 25468709 | KIAA1671 | ENSG00000197077.8 | 7.59041E-7 | 0.02 | 120012 | gtex_brain_ba24 |
| rs5996831 | 22 | 25469310 | KIAA1671 | ENSG00000197077.8 | 7.66206E-7 | 0.02 | 120613 | gtex_brain_ba24 |
| rs6004425 | 22 | 25469846 | KIAA1671 | ENSG00000197077.8 | 7.75057E-7 | 0.02 | 121149 | gtex_brain_ba24 |
| rs9306409 | 22 | 25470546 | KIAA1671 | ENSG00000197077.8 | 4.32499E-7 | 0.02 | 121849 | gtex_brain_ba24 |
| rs201587119 | 22 | 25470555 | KIAA1671 | ENSG00000197077.8 | 6.99815E-7 | 0.02 | 121858 | gtex_brain_ba24 |
| rs9306410 | 22 | 25470557 | KIAA1671 | ENSG00000197077.8 | 5.26342E-7 | 0.02 | 121860 | gtex_brain_ba24 |
Section II. Transcriptome annotation
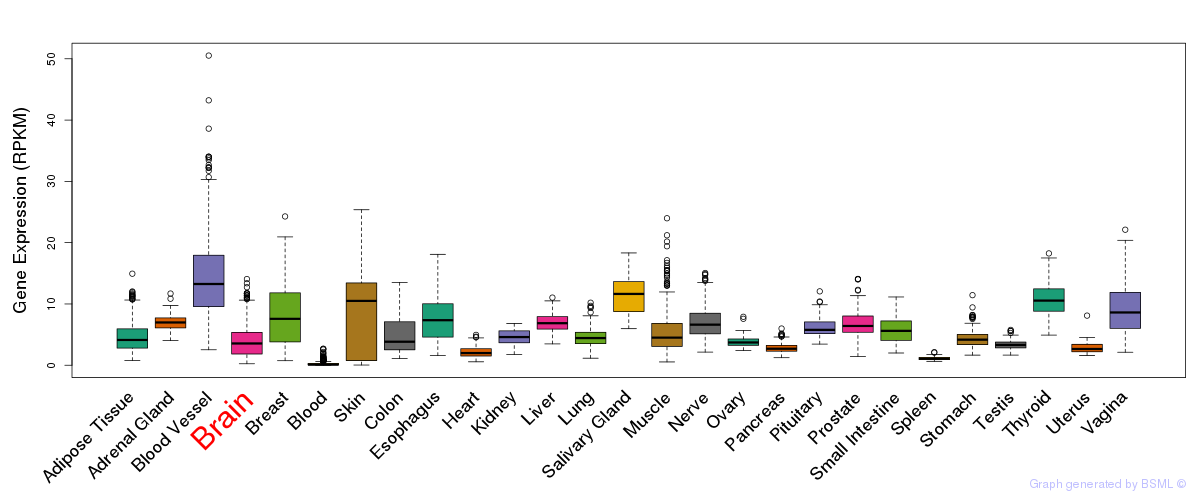
General gene expression (GTEx)

Gene expression during devlopment (BrainCloud)
Footnote:
A total of 269 time points ploted, with n=38 fetal samples (x=1:38). Each triangle represents one time point.
Gene expression of temporal and spatial changes (BrainSpan)
Footnote:
SC: sub-cortical regions; SM: sensory-motor regions; FC: frontal cortex; and TP: temporal-parietal cortex
ST1: fetal (13 - 26 postconception weeks), ST2: early infancy to late childhood (4 months to 11 years), and ST3: adolescence to adulthood (13 - 23 years)
The bar shown representes the lower 25% and upper 25% of the expression distribution.
No co-expressed genes in brain regions
Section V. Pathway annotation
| Pathway name | Pathway size | # SZGR 2.0 genes in pathway | Info |
|---|---|---|---|
| FULCHER INFLAMMATORY RESPONSE LECTIN VS LPS UP | 579 | 346 | All SZGR 2.0 genes in this pathway |
| RODRIGUES THYROID CARCINOMA POORLY DIFFERENTIATED DN | 805 | 505 | All SZGR 2.0 genes in this pathway |
| RODRIGUES THYROID CARCINOMA ANAPLASTIC DN | 537 | 339 | All SZGR 2.0 genes in this pathway |
| PEREZ TP53 TARGETS | 1174 | 695 | All SZGR 2.0 genes in this pathway |
| CREIGHTON ENDOCRINE THERAPY RESISTANCE 3 | 720 | 440 | All SZGR 2.0 genes in this pathway |
| CREIGHTON ENDOCRINE THERAPY RESISTANCE 5 | 482 | 296 | All SZGR 2.0 genes in this pathway |
| KRIEG HYPOXIA NOT VIA KDM3A | 770 | 480 | All SZGR 2.0 genes in this pathway |