Gene Page: DISP2
Summary ?
| GeneID | 85455 |
| Symbol | DISP2 |
| Synonyms | DISPB|HsT16908 |
| Description | dispatched RND transporter family member 2 |
| Reference | MIM:607503|HGNC:HGNC:19712|HPRD:06327| |
| Gene type | protein-coding |
| Map location | 15q15.1 |
| Pascal p-value | 0.229 |
| Sherlock p-value | 0.009 |
| Fetal beta | -0.541 |
| eGene | Anterior cingulate cortex BA24 Caudate basal ganglia Cortex Hippocampus Nucleus accumbens basal ganglia Putamen basal ganglia |
| Support | CompositeSet Darnell FMRP targets |
Gene in Data Sources
| Gene set name | Method of gene set | Description | Info |
|---|---|---|---|
| CV:PGCnp | Genome-wide Association Study | GWAS |
Section I. Genetics and epigenetics annotation
 eQTL annotation
| SNP ID | Chromosome | Position | eGene | Gene Entrez ID | pvalue | qvalue | TSS distance | eQTL type |
|---|---|---|---|---|---|---|---|---|
| rs16970633 | 15 | 40642877 | DISP2 | ENSG00000140323.4 | 2.553E-6 | 0.03 | -7559 | gtex_brain_ba24 |
| rs35777573 | 15 | 40644246 | DISP2 | ENSG00000140323.4 | 4.788E-6 | 0.03 | -6190 | gtex_brain_ba24 |
| rs7164581 | 15 | 40645098 | DISP2 | ENSG00000140323.4 | 4.788E-6 | 0.03 | -5338 | gtex_brain_ba24 |
| rs7164606 | 15 | 40645133 | DISP2 | ENSG00000140323.4 | 2.553E-6 | 0.03 | -5303 | gtex_brain_ba24 |
| rs12911108 | 15 | 40628671 | DISP2 | ENSG00000140323.4 | 8.904E-7 | 0 | -21765 | gtex_brain_putamen_basal |
| rs71472431 | 15 | 40635859 | DISP2 | ENSG00000140323.4 | 6.523E-7 | 0 | -14577 | gtex_brain_putamen_basal |
| rs16970633 | 15 | 40642877 | DISP2 | ENSG00000140323.4 | 8.953E-8 | 0 | -7559 | gtex_brain_putamen_basal |
| rs35777573 | 15 | 40644246 | DISP2 | ENSG00000140323.4 | 2.866E-8 | 0 | -6190 | gtex_brain_putamen_basal |
| rs7164581 | 15 | 40645098 | DISP2 | ENSG00000140323.4 | 8.953E-8 | 0 | -5338 | gtex_brain_putamen_basal |
| rs7164606 | 15 | 40645133 | DISP2 | ENSG00000140323.4 | 8.953E-8 | 0 | -5303 | gtex_brain_putamen_basal |
| rs34791483 | 15 | 40646143 | DISP2 | ENSG00000140323.4 | 1.651E-7 | 0 | -4293 | gtex_brain_putamen_basal |
| rs71472433 | 15 | 40649609 | DISP2 | ENSG00000140323.4 | 1.451E-7 | 0 | -827 | gtex_brain_putamen_basal |
| rs56221586 | 15 | 40650402 | DISP2 | ENSG00000140323.4 | 2.227E-7 | 0 | -34 | gtex_brain_putamen_basal |
| rs12913300 | 15 | 40655444 | DISP2 | ENSG00000140323.4 | 1.087E-6 | 0 | 5008 | gtex_brain_putamen_basal |
| rs35565646 | 15 | 40660515 | DISP2 | ENSG00000140323.4 | 1.856E-6 | 0 | 10079 | gtex_brain_putamen_basal |
| rs3803360 | 15 | 40662669 | DISP2 | ENSG00000140323.4 | 2.319E-6 | 0 | 12233 | gtex_brain_putamen_basal |
| rs3803359 | 15 | 40662748 | DISP2 | ENSG00000140323.4 | 2.318E-6 | 0 | 12312 | gtex_brain_putamen_basal |
| rs12905240 | 15 | 40672145 | DISP2 | ENSG00000140323.4 | 7.196E-7 | 0 | 21709 | gtex_brain_putamen_basal |
Section II. Transcriptome annotation
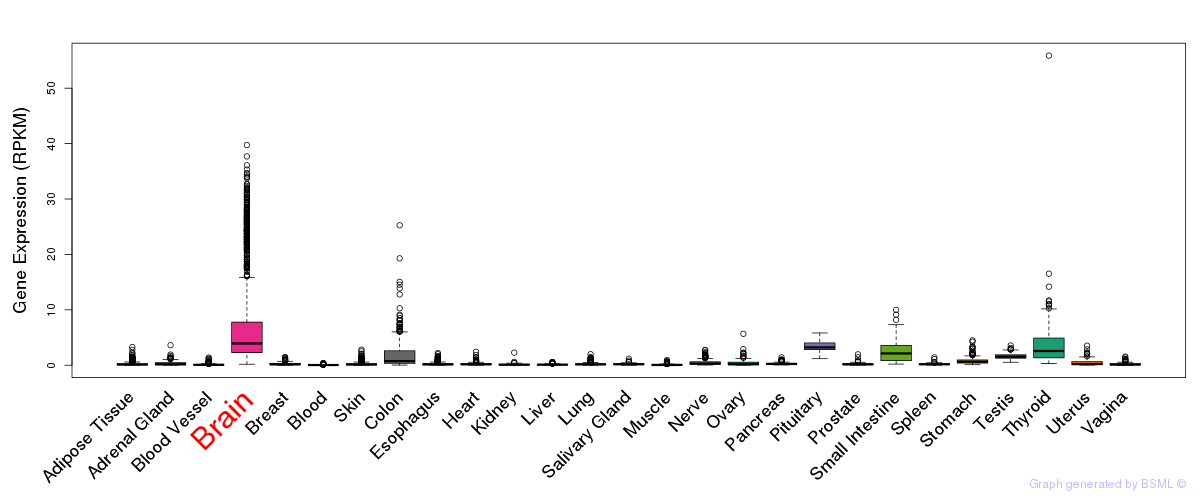
General gene expression (GTEx)
Gene expression during devlopment (BrainCloud)
Footnote:
A total of 269 time points ploted, with n=38 fetal samples (x=1:38). Each triangle represents one time point.
Gene expression of temporal and spatial changes (BrainSpan)
Footnote:
SC: sub-cortical regions; SM: sensory-motor regions; FC: frontal cortex; and TP: temporal-parietal cortex
ST1: fetal (13 - 26 postconception weeks), ST2: early infancy to late childhood (4 months to 11 years), and ST3: adolescence to adulthood (13 - 23 years)
The bar shown representes the lower 25% and upper 25% of the expression distribution.
No co-expressed genes in brain regions
Section V. Pathway annotation
| Pathway name | Pathway size | # SZGR 2.0 genes in pathway | Info |
|---|---|---|---|
| PEREZ TP53 TARGETS | 1174 | 695 | All SZGR 2.0 genes in this pathway |
| NUYTTEN NIPP1 TARGETS UP | 769 | 437 | All SZGR 2.0 genes in this pathway |
| LEIN NEURON MARKERS | 69 | 45 | All SZGR 2.0 genes in this pathway |
| WANG RESPONSE TO GSK3 INHIBITOR SB216763 DN | 374 | 217 | All SZGR 2.0 genes in this pathway |
| WAKABAYASHI ADIPOGENESIS PPARG BOUND 36HR | 29 | 23 | All SZGR 2.0 genes in this pathway |
| WAKABAYASHI ADIPOGENESIS PPARG BOUND 8D | 658 | 397 | All SZGR 2.0 genes in this pathway |