Gene Page: FUBP3
Summary ?
| GeneID | 8939 |
| Symbol | FUBP3 |
| Synonyms | FBP3 |
| Description | far upstream element (FUSE) binding protein 3 |
| Reference | MIM:603536|HGNC:HGNC:4005|Ensembl:ENSG00000107164|Vega:OTTHUMG00000020809 |
| Gene type | protein-coding |
| Map location | 9q34.11 |
| Pascal p-value | 0.092 |
| Sherlock p-value | 0.008 |
| Fetal beta | 1.553 |
| eGene | Meta |
Gene in Data Sources
| Gene set name | Method of gene set | Description | Info |
|---|---|---|---|
| CV:PGCnp | Genome-wide Association Study | GWAS |
Section I. Genetics and epigenetics annotation
Section II. Transcriptome annotation
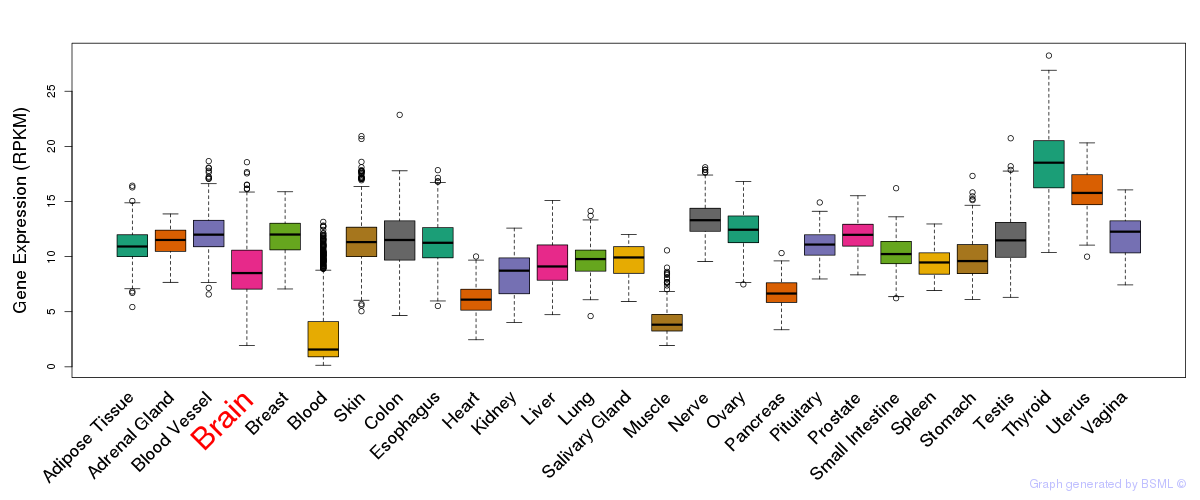
General gene expression (GTEx)
Gene expression during devlopment (BrainCloud)
Footnote:
A total of 269 time points ploted, with n=38 fetal samples (x=1:38). Each triangle represents one time point.
Gene expression of temporal and spatial changes (BrainSpan)
Footnote:
SC: sub-cortical regions; SM: sensory-motor regions; FC: frontal cortex; and TP: temporal-parietal cortex
ST1: fetal (13 - 26 postconception weeks), ST2: early infancy to late childhood (4 months to 11 years), and ST3: adolescence to adulthood (13 - 23 years)
The bar shown representes the lower 25% and upper 25% of the expression distribution.
Top co-expressed genes in brain regions
| Top 10 positively co-expressed genes | ||
| Gene | Pearson's Correlation | Spearman's Correlation |
| GPR116 | 0.75 | 0.82 |
| PTPRB | 0.73 | 0.80 |
| COBLL1 | 0.72 | 0.79 |
| VWF | 0.72 | 0.71 |
| CDGAP | 0.71 | 0.75 |
| RNF144B | 0.71 | 0.79 |
| TIMP3 | 0.71 | 0.76 |
| ITIH5 | 0.70 | 0.74 |
| OSMR | 0.70 | 0.76 |
| SLCO2B1 | 0.70 | 0.73 |
| Top 10 negatively co-expressed genes | ||
| Gene | Pearson's Correlation | Spearman's Correlation |
| SNHG12 | -0.48 | -0.52 |
| C12orf45 | -0.45 | -0.50 |
| RP9P | -0.43 | -0.50 |
| RP9 | -0.41 | -0.41 |
| AC132872.1 | -0.41 | -0.41 |
| RPS27A | -0.41 | -0.53 |
| RPS21 | -0.40 | -0.53 |
| NDUFAF2 | -0.40 | -0.43 |
| RPS13P2 | -0.39 | -0.49 |
| UXT | -0.39 | -0.47 |
Section V. Pathway annotation
| Pathway name | Pathway size | # SZGR 2.0 genes in pathway | Info |
|---|---|---|---|
| GARY CD5 TARGETS DN | 431 | 263 | All SZGR 2.0 genes in this pathway |
| ZHOU INFLAMMATORY RESPONSE LIVE UP | 485 | 293 | All SZGR 2.0 genes in this pathway |
| TIEN INTESTINE PROBIOTICS 2HR DN | 88 | 53 | All SZGR 2.0 genes in this pathway |
| ZHOU INFLAMMATORY RESPONSE FIMA UP | 544 | 308 | All SZGR 2.0 genes in this pathway |
| KIM WT1 TARGETS DN | 459 | 276 | All SZGR 2.0 genes in this pathway |
| LINDGREN BLADDER CANCER CLUSTER 1 UP | 121 | 71 | All SZGR 2.0 genes in this pathway |
| LINDGREN BLADDER CANCER CLUSTER 2A DN | 141 | 84 | All SZGR 2.0 genes in this pathway |
| LINDGREN BLADDER CANCER WITH LOH IN CHR9Q | 116 | 71 | All SZGR 2.0 genes in this pathway |
| SCHLOSSER SERUM RESPONSE DN | 712 | 443 | All SZGR 2.0 genes in this pathway |
| NUYTTEN EZH2 TARGETS DN | 1024 | 594 | All SZGR 2.0 genes in this pathway |
| XU RESPONSE TO TRETINOIN DN | 13 | 8 | All SZGR 2.0 genes in this pathway |
| BONOME OVARIAN CANCER SURVIVAL SUBOPTIMAL DEBULKING | 510 | 309 | All SZGR 2.0 genes in this pathway |
| DORN ADENOVIRUS INFECTION 12HR DN | 33 | 25 | All SZGR 2.0 genes in this pathway |
| DORN ADENOVIRUS INFECTION 24HR DN | 43 | 32 | All SZGR 2.0 genes in this pathway |
| DORN ADENOVIRUS INFECTION 32HR DN | 39 | 28 | All SZGR 2.0 genes in this pathway |
| DORN ADENOVIRUS INFECTION 48HR UP | 14 | 9 | All SZGR 2.0 genes in this pathway |
| DELACROIX RAR BOUND ES | 462 | 273 | All SZGR 2.0 genes in this pathway |
| RAO BOUND BY SALL4 ISOFORM B | 517 | 302 | All SZGR 2.0 genes in this pathway |