Gene Page: SHKBP1
Summary ?
| GeneID | 92799 |
| Symbol | SHKBP1 |
| Synonyms | PP203|Sb1 |
| Description | SH3KBP1 binding protein 1 |
| Reference | HGNC:HGNC:19214|Ensembl:ENSG00000160410|HPRD:15338|Vega:OTTHUMG00000182602 |
| Gene type | protein-coding |
| Map location | 19q13.2 |
| Pascal p-value | 0.38 |
| TADA p-value | 0.016 |
| Fetal beta | -0.508 |
| DMG | 1 (# studies) |
| Support | CompositeSet |
Gene in Data Sources
| Gene set name | Method of gene set | Description | Info |
|---|---|---|---|
| CV:PGCnp | Genome-wide Association Study | GWAS | |
| DMG:Wockner_2014 | Genome-wide DNA methylation analysis | This dataset includes 4641 differentially methylated probes corresponding to 2929 unique genes between schizophrenia patients (n=24) and controls (n=24). | 2 |
| DNM:Fromer_2014 | Whole Exome Sequencing analysis | This study reported a WES study of 623 schizophrenia trios, reporting DNMs using genomic DNA. |
Section I. Genetics and epigenetics annotation
 DNM table
| Gene | Chromosome | Position | Ref | Alt | Transcript | AA change | Mutation type | Sift | CG46 | Trait | Study |
|---|---|---|---|---|---|---|---|---|---|---|---|
| SHKBP1 | chr19 | 41096218 | C | G | NM_138392 | p.553S>C | missense | Schizophrenia | DNM:Fromer_2014 |
Differentially methylated gene
| Probe | Chromosome | Position | Nearest gene | P (dis) | Beta (dis) | FDR (dis) | Study |
|---|---|---|---|---|---|---|---|
| cg12187069 | 19 | 41082589 | SHKBP1 | 1.36E-6 | -0.455 | 0.007 | DMG:Wockner_2014 |
| cg07989796 | 19 | 41082579 | SHKBP1 | 3.58E-5 | -0.318 | 0.02 | DMG:Wockner_2014 |
Section II. Transcriptome annotation
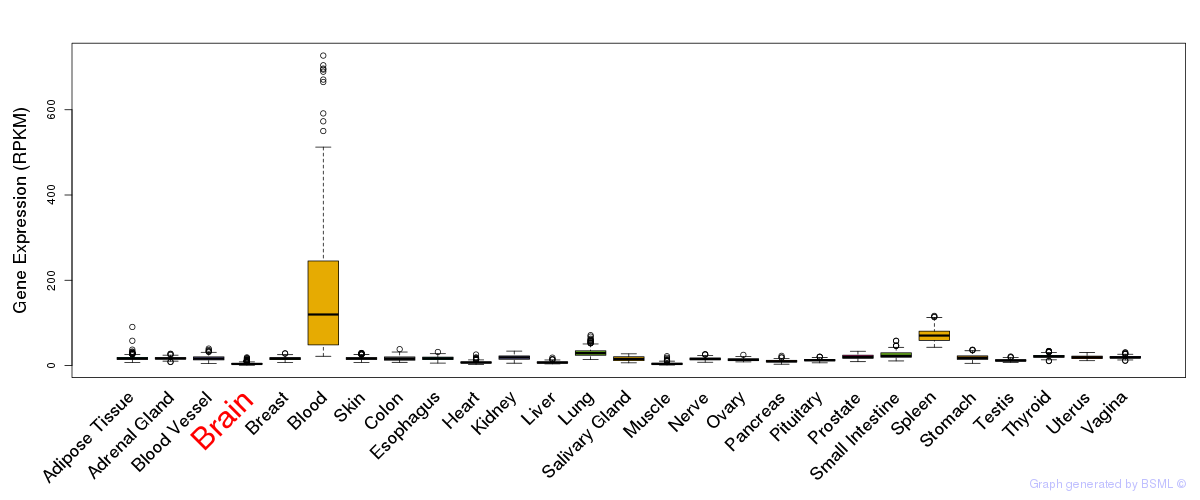
General gene expression (GTEx)
Gene expression during devlopment (BrainCloud)
Footnote:
A total of 269 time points ploted, with n=38 fetal samples (x=1:38). Each triangle represents one time point.
Gene expression of temporal and spatial changes (BrainSpan)
Footnote:
SC: sub-cortical regions; SM: sensory-motor regions; FC: frontal cortex; and TP: temporal-parietal cortex
ST1: fetal (13 - 26 postconception weeks), ST2: early infancy to late childhood (4 months to 11 years), and ST3: adolescence to adulthood (13 - 23 years)
The bar shown representes the lower 25% and upper 25% of the expression distribution.
No co-expressed genes in brain regions
Section V. Pathway annotation
| Pathway name | Pathway size | # SZGR 2.0 genes in pathway | Info |
|---|---|---|---|
| GARY CD5 TARGETS UP | 473 | 314 | All SZGR 2.0 genes in this pathway |
| VECCHI GASTRIC CANCER EARLY UP | 430 | 232 | All SZGR 2.0 genes in this pathway |
| GRAESSMANN APOPTOSIS BY DOXORUBICIN DN | 1781 | 1082 | All SZGR 2.0 genes in this pathway |
| GRAESSMANN RESPONSE TO MC AND DOXORUBICIN DN | 770 | 415 | All SZGR 2.0 genes in this pathway |
| PATIL LIVER CANCER | 747 | 453 | All SZGR 2.0 genes in this pathway |
| LIAO METASTASIS | 539 | 324 | All SZGR 2.0 genes in this pathway |
| SCHAEFFER PROSTATE DEVELOPMENT 6HR DN | 514 | 330 | All SZGR 2.0 genes in this pathway |
| DOUGLAS BMI1 TARGETS DN | 314 | 188 | All SZGR 2.0 genes in this pathway |
| BRUINS UVC RESPONSE VIA TP53 GROUP C | 92 | 60 | All SZGR 2.0 genes in this pathway |
| KASLER HDAC7 TARGETS 1 UP | 194 | 133 | All SZGR 2.0 genes in this pathway |