Gene Page: GPR37L1
Summary ?
| GeneID | 9283 |
| Symbol | GPR37L1 |
| Synonyms | ET(B)R-LP-2|ETBR-LP-2 |
| Description | G protein-coupled receptor 37 like 1 |
| Reference | HGNC:HGNC:14923|HPRD:13603| |
| Gene type | protein-coding |
| Map location | 1q32.1 |
| Fetal beta | -2.443 |
| DMG | 1 (# studies) |
| eGene | Myers' cis & trans |
Gene in Data Sources
| Gene set name | Method of gene set | Description | Info |
|---|---|---|---|
| CV:PGCnp | Genome-wide Association Study | GWAS | |
| DMG:Wockner_2014 | Genome-wide DNA methylation analysis | This dataset includes 4641 differentially methylated probes corresponding to 2929 unique genes between schizophrenia patients (n=24) and controls (n=24). | 1 |
Section I. Genetics and epigenetics annotation
 Differentially methylated gene
| Probe | Chromosome | Position | Nearest gene | P (dis) | Beta (dis) | FDR (dis) | Study |
|---|---|---|---|---|---|---|---|
| cg02124912 | 1 | 202091933 | GPR37L1 | 4.55E-5 | -0.617 | 0.021 | DMG:Wockner_2014 |
eQTL annotation
| SNP ID | Chromosome | Position | eGene | Gene Entrez ID | pvalue | qvalue | TSS distance | eQTL type |
|---|---|---|---|---|---|---|---|---|
| rs4652689 | chr1 | 182109930 | GPR37L1 | 9283 | 0.16 | trans |
Section II. Transcriptome annotation
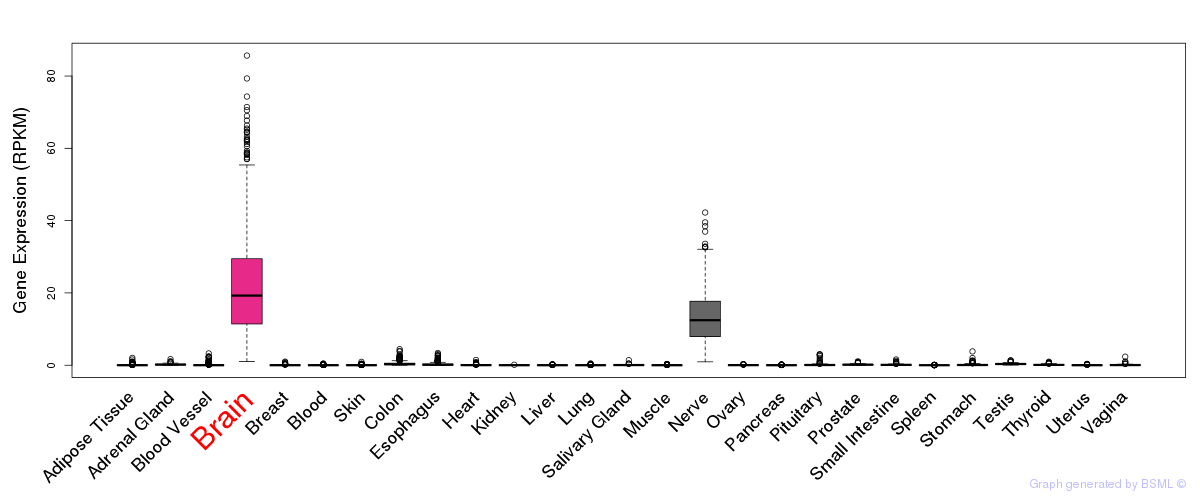
General gene expression (GTEx)
Gene expression during devlopment (BrainCloud)
Footnote:
A total of 269 time points ploted, with n=38 fetal samples (x=1:38). Each triangle represents one time point.
Gene expression of temporal and spatial changes (BrainSpan)
Footnote:
SC: sub-cortical regions; SM: sensory-motor regions; FC: frontal cortex; and TP: temporal-parietal cortex
ST1: fetal (13 - 26 postconception weeks), ST2: early infancy to late childhood (4 months to 11 years), and ST3: adolescence to adulthood (13 - 23 years)
The bar shown representes the lower 25% and upper 25% of the expression distribution.
Top co-expressed genes in brain regions
| Top 10 positively co-expressed genes | ||
| Gene | Pearson's Correlation | Spearman's Correlation |
| MRPS22 | 0.81 | 0.81 |
| PDCD10 | 0.79 | 0.79 |
| CCDC104 | 0.79 | 0.77 |
| RP4-604K5.1 | 0.78 | 0.79 |
| TMEM126B | 0.77 | 0.68 |
| CRBN | 0.77 | 0.69 |
| AC025647.1 | 0.76 | 0.74 |
| THOC7 | 0.75 | 0.74 |
| TTC1 | 0.75 | 0.75 |
| AMZ2 | 0.75 | 0.72 |
| Top 10 negatively co-expressed genes | ||
| Gene | Pearson's Correlation | Spearman's Correlation |
| MTSS1L | -0.41 | -0.44 |
| AF347015.18 | -0.40 | -0.31 |
| C10orf108 | -0.40 | -0.47 |
| AC016705.1 | -0.40 | -0.42 |
| AC100783.1 | -0.39 | -0.45 |
| AC010300.1 | -0.39 | -0.43 |
| SPATC1 | -0.38 | -0.41 |
| AC010618.2 | -0.37 | -0.42 |
| C9orf131 | -0.37 | -0.44 |
| AC073957.1 | -0.37 | -0.42 |
Section V. Pathway annotation
| Pathway name | Pathway size | # SZGR 2.0 genes in pathway | Info |
|---|---|---|---|
| JAZAG TGFB1 SIGNALING VIA SMAD4 UP | 108 | 66 | All SZGR 2.0 genes in this pathway |
| PUJANA BRCA1 PCC NETWORK | 1652 | 1023 | All SZGR 2.0 genes in this pathway |
| PUJANA ATM PCC NETWORK | 1442 | 892 | All SZGR 2.0 genes in this pathway |
| TSENG IRS1 TARGETS DN | 135 | 88 | All SZGR 2.0 genes in this pathway |
| LEIN ASTROCYTE MARKERS | 42 | 35 | All SZGR 2.0 genes in this pathway |
| HUNSBERGER EXERCISE REGULATED GENES | 31 | 26 | All SZGR 2.0 genes in this pathway |
| BHAT ESR1 TARGETS VIA AKT1 UP | 281 | 183 | All SZGR 2.0 genes in this pathway |
| ACEVEDO FGFR1 TARGETS IN PROSTATE CANCER MODEL DN | 308 | 187 | All SZGR 2.0 genes in this pathway |