Gene Page: TRIP11
Summary ?
| GeneID | 9321 |
| Symbol | TRIP11 |
| Synonyms | ACG1A|CEV14|GMAP-210|GMAP210|TRIP-11|TRIP230 |
| Description | thyroid hormone receptor interactor 11 |
| Reference | MIM:604505|HGNC:HGNC:12305|Ensembl:ENSG00000100815|HPRD:05143|Vega:OTTHUMG00000171128 |
| Gene type | protein-coding |
| Map location | 14q32.12 |
| Pascal p-value | 0.417 |
| Fetal beta | 0.481 |
| DMG | 1 (# studies) |
| eGene | Myers' cis & trans |
| Support | Ascano FMRP targets |
Gene in Data Sources
| Gene set name | Method of gene set | Description | Info |
|---|---|---|---|
| CV:PGCnp | Genome-wide Association Study | GWAS | |
| DMG:Jaffe_2016 | Genome-wide DNA methylation analysis | This dataset includes 2,104 probes/CpGs associated with SZ patients (n=108) compared to 136 controls at Bonferroni-adjusted P < 0.05. | 1 |
Section I. Genetics and epigenetics annotation
 Differentially methylated gene
| Probe | Chromosome | Position | Nearest gene | P (dis) | Beta (dis) | FDR (dis) | Study |
|---|---|---|---|---|---|---|---|
| cg06279414 | 14 | 92506140 | TRIP11 | 4.3E-8 | -0.011 | 1.19E-5 | DMG:Jaffe_2016 |
 eQTL annotation
| SNP ID | Chromosome | Position | eGene | Gene Entrez ID | pvalue | qvalue | TSS distance | eQTL type |
|---|---|---|---|---|---|---|---|---|
| rs997135 | chr20 | 12330295 | TRIP11 | 9321 | 0.16 | trans |
Section II. Transcriptome annotation
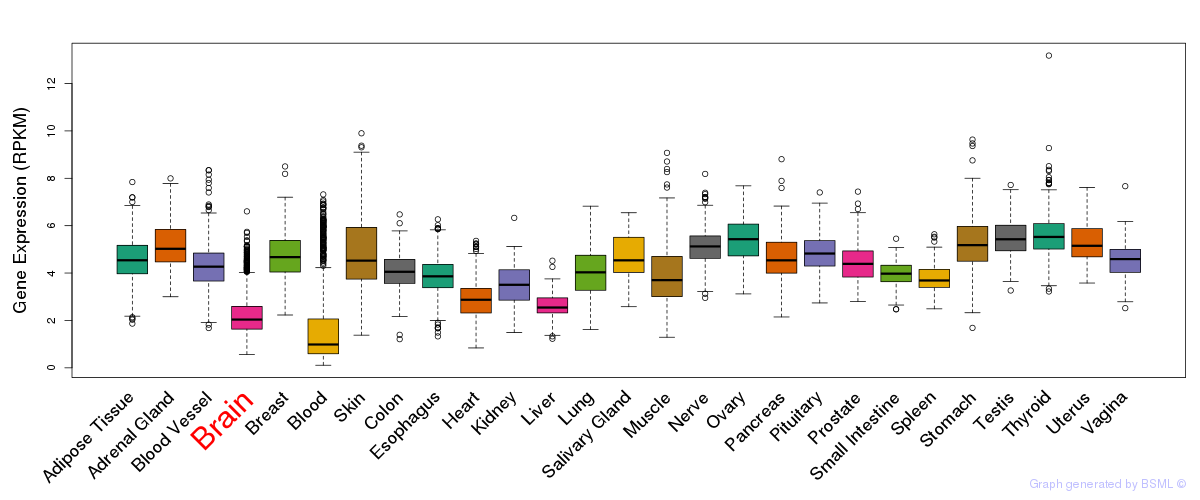
General gene expression (GTEx)

Gene expression during devlopment (BrainCloud)
Footnote:
A total of 269 time points ploted, with n=38 fetal samples (x=1:38). Each triangle represents one time point.
Gene expression of temporal and spatial changes (BrainSpan)
Footnote:
SC: sub-cortical regions; SM: sensory-motor regions; FC: frontal cortex; and TP: temporal-parietal cortex
ST1: fetal (13 - 26 postconception weeks), ST2: early infancy to late childhood (4 months to 11 years), and ST3: adolescence to adulthood (13 - 23 years)
The bar shown representes the lower 25% and upper 25% of the expression distribution.
Top co-expressed genes in brain regions
| Top 10 positively co-expressed genes | ||
| Gene | Pearson's Correlation | Spearman's Correlation |
| MTM1 | 0.78 | 0.81 |
| TOR1AIP1 | 0.77 | 0.79 |
| ITGA6 | 0.76 | 0.78 |
| SEPT2 | 0.76 | 0.72 |
| PDLIM5 | 0.76 | 0.81 |
| PLOD2 | 0.76 | 0.81 |
| PARP4 | 0.75 | 0.76 |
| AP000872.1 | 0.75 | 0.74 |
| HEATR5A | 0.75 | 0.72 |
| SULT1C4 | 0.75 | 0.72 |
| Top 10 negatively co-expressed genes | ||
| Gene | Pearson's Correlation | Spearman's Correlation |
| IER5L | -0.29 | -0.23 |
| RPL9 | -0.26 | -0.30 |
| IL32 | -0.26 | -0.21 |
| SCUBE1 | -0.24 | -0.13 |
| C17orf37 | -0.24 | -0.22 |
| TBR1 | -0.24 | -0.06 |
| NANOS3 | -0.23 | -0.24 |
| CYP26A1 | -0.23 | -0.20 |
| SLC5A8 | -0.23 | -0.17 |
| SLC35F2 | -0.23 | 0.02 |
Section V. Pathway annotation
| Pathway name | Pathway size | # SZGR 2.0 genes in pathway | Info |
|---|---|---|---|
| RODRIGUES DCC TARGETS DN | 121 | 84 | All SZGR 2.0 genes in this pathway |
| GINESTIER BREAST CANCER ZNF217 AMPLIFIED UP | 78 | 48 | All SZGR 2.0 genes in this pathway |
| RODRIGUES THYROID CARCINOMA POORLY DIFFERENTIATED UP | 633 | 376 | All SZGR 2.0 genes in this pathway |
| GRAESSMANN APOPTOSIS BY DOXORUBICIN DN | 1781 | 1082 | All SZGR 2.0 genes in this pathway |
| GRAESSMANN RESPONSE TO MC AND DOXORUBICIN DN | 770 | 415 | All SZGR 2.0 genes in this pathway |
| GAUSSMANN MLL AF4 FUSION TARGETS G UP | 238 | 135 | All SZGR 2.0 genes in this pathway |
| HAMAI APOPTOSIS VIA TRAIL UP | 584 | 356 | All SZGR 2.0 genes in this pathway |
| NUYTTEN NIPP1 TARGETS UP | 769 | 437 | All SZGR 2.0 genes in this pathway |
| RICKMAN TUMOR DIFFERENTIATED WELL VS POORLY DN | 382 | 224 | All SZGR 2.0 genes in this pathway |
| RICKMAN TUMOR DIFFERENTIATED MODERATELY VS POORLY UP | 121 | 71 | All SZGR 2.0 genes in this pathway |
| CUI TCF21 TARGETS 2 DN | 830 | 547 | All SZGR 2.0 genes in this pathway |
| SANSOM APC TARGETS | 212 | 121 | All SZGR 2.0 genes in this pathway |
| BREDEMEYER RAG SIGNALING VIA ATM NOT VIA NFKB DN | 38 | 23 | All SZGR 2.0 genes in this pathway |
| GRESHOCK CANCER COPY NUMBER UP | 323 | 240 | All SZGR 2.0 genes in this pathway |
| BOYLAN MULTIPLE MYELOMA D CLUSTER DN | 40 | 26 | All SZGR 2.0 genes in this pathway |
| BOYLAN MULTIPLE MYELOMA C D DN | 252 | 155 | All SZGR 2.0 genes in this pathway |
| GREGORY SYNTHETIC LETHAL WITH IMATINIB | 145 | 83 | All SZGR 2.0 genes in this pathway |
| GOBERT OLIGODENDROCYTE DIFFERENTIATION DN | 1080 | 713 | All SZGR 2.0 genes in this pathway |
| KUMAR PATHOGEN LOAD BY MACROPHAGES | 275 | 155 | All SZGR 2.0 genes in this pathway |