Gene Page: WSCD2
Summary ?
| GeneID | 9671 |
| Symbol | WSCD2 |
| Synonyms | - |
| Description | WSC domain containing 2 |
| Reference | HGNC:HGNC:29117|Ensembl:ENSG00000075035|HPRD:17196|Vega:OTTHUMG00000169579 |
| Gene type | protein-coding |
| Map location | 12q23.3 |
| Pascal p-value | 0.002 |
| Sherlock p-value | 0.116 |
| Fetal beta | -2.832 |
| eGene | Myers' cis & trans |
Gene in Data Sources
| Gene set name | Method of gene set | Description | Info |
|---|---|---|---|
| CV:GWASdb | Genome-wide Association Studies | GWASdb records for schizophrenia | |
| CV:PGCnp | Genome-wide Association Study | GWAS | |
| Expression | Meta-analysis of gene expression | P value: 2.231 |
Section I. Genetics and epigenetics annotation
 eQTL annotation
| SNP ID | Chromosome | Position | eGene | Gene Entrez ID | pvalue | qvalue | TSS distance | eQTL type |
|---|---|---|---|---|---|---|---|---|
| rs17392743 | chr1 | 54764240 | WSCD2 | 9671 | 0.19 | trans | ||
| rs2502827 | chr1 | 176044216 | WSCD2 | 9671 | 0.19 | trans | ||
| rs16829545 | chr2 | 151977407 | WSCD2 | 9671 | 6.395E-8 | trans | ||
| rs3845734 | chr2 | 171125572 | WSCD2 | 9671 | 0 | trans | ||
| rs7584986 | chr2 | 184111432 | WSCD2 | 9671 | 2.745E-6 | trans | ||
| rs17762315 | chr5 | 76807576 | WSCD2 | 9671 | 0.03 | trans | ||
| rs2393316 | chr10 | 59333070 | WSCD2 | 9671 | 0.2 | trans | ||
| rs1255634 | chr14 | 63972654 | WSCD2 | 9671 | 0.16 | trans | ||
| rs16955618 | chr15 | 29937543 | WSCD2 | 9671 | 1.577E-15 | trans | ||
| rs1041786 | chr21 | 22617710 | WSCD2 | 9671 | 0.06 | trans |
Section II. Transcriptome annotation
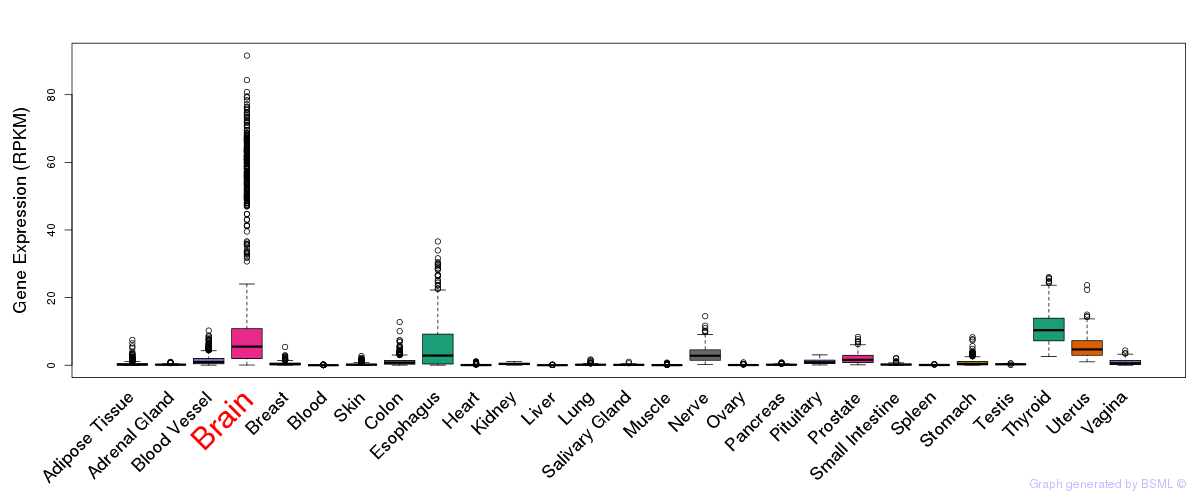
General gene expression (GTEx)

Gene expression during devlopment (BrainCloud)
Footnote:
A total of 269 time points ploted, with n=38 fetal samples (x=1:38). Each triangle represents one time point.
Gene expression of temporal and spatial changes (BrainSpan)
Footnote:
SC: sub-cortical regions; SM: sensory-motor regions; FC: frontal cortex; and TP: temporal-parietal cortex
ST1: fetal (13 - 26 postconception weeks), ST2: early infancy to late childhood (4 months to 11 years), and ST3: adolescence to adulthood (13 - 23 years)
The bar shown representes the lower 25% and upper 25% of the expression distribution.
Top co-expressed genes in brain regions
| Top 10 positively co-expressed genes | ||
| Gene | Pearson's Correlation | Spearman's Correlation |
| RNF216 | 0.92 | 0.92 |
| C22orf30 | 0.92 | 0.93 |
| GAPVD1 | 0.91 | 0.92 |
| ADAR | 0.91 | 0.92 |
| ANKFY1 | 0.91 | 0.93 |
| ANKRD17 | 0.91 | 0.91 |
| KIAA0947 | 0.91 | 0.92 |
| KDM2A | 0.91 | 0.93 |
| VPS13B | 0.90 | 0.91 |
| UBR2 | 0.90 | 0.92 |
| Top 10 negatively co-expressed genes | ||
| Gene | Pearson's Correlation | Spearman's Correlation |
| AF347015.31 | -0.75 | -0.77 |
| MT-CO2 | -0.73 | -0.76 |
| HIGD1B | -0.72 | -0.77 |
| AF347015.21 | -0.72 | -0.79 |
| IFI27 | -0.71 | -0.72 |
| FXYD1 | -0.70 | -0.73 |
| C1orf54 | -0.69 | -0.79 |
| AF347015.8 | -0.67 | -0.72 |
| MT-CYB | -0.67 | -0.70 |
| AF347015.33 | -0.67 | -0.68 |
Section III. Gene Ontology annotation
| Cellular component | GO term | Evidence | Neuro keywords | PubMed ID |
|---|---|---|---|---|
| GO:0016020 | membrane | IEA | - | |
| GO:0016021 | integral to membrane | IEA | - |
Section V. Pathway annotation
| Pathway name | Pathway size | # SZGR 2.0 genes in pathway | Info |
|---|---|---|---|
| GAUSSMANN MLL AF4 FUSION TARGETS A DN | 90 | 61 | All SZGR 2.0 genes in this pathway |
| SHEN SMARCA2 TARGETS DN | 357 | 212 | All SZGR 2.0 genes in this pathway |
| WEBER METHYLATED IN COLON CANCER | 18 | 13 | All SZGR 2.0 genes in this pathway |
| MEISSNER NPC HCP WITH H3K4ME2 AND H3K27ME3 | 349 | 234 | All SZGR 2.0 genes in this pathway |
| MIKKELSEN MCV6 HCP WITH H3K27ME3 | 435 | 318 | All SZGR 2.0 genes in this pathway |
| FONTAINE FOLLICULAR THYROID ADENOMA UP | 75 | 43 | All SZGR 2.0 genes in this pathway |
| YANG BCL3 TARGETS UP | 364 | 236 | All SZGR 2.0 genes in this pathway |
Section VI. microRNA annotation
| miRNA family | Target position | miRNA ID | miRNA seq | ||
|---|---|---|---|---|---|
| UTR start | UTR end | Match method | |||
| miR-135 | 1262 | 1269 | 1A,m8 | hsa-miR-135a | UAUGGCUUUUUAUUCCUAUGUGA |
| hsa-miR-135b | UAUGGCUUUUCAUUCCUAUGUG | ||||
| miR-181 | 1546 | 1553 | 1A,m8 | hsa-miR-181abrain | AACAUUCAACGCUGUCGGUGAGU |
| hsa-miR-181bSZ | AACAUUCAUUGCUGUCGGUGGG | ||||
| hsa-miR-181cbrain | AACAUUCAACCUGUCGGUGAGU | ||||
| hsa-miR-181dbrain | AACAUUCAUUGUUGUCGGUGGGUU | ||||
| miR-29 | 585 | 591 | m8 | hsa-miR-29aSZ | UAGCACCAUCUGAAAUCGGUU |
| hsa-miR-29bSZ | UAGCACCAUUUGAAAUCAGUGUU | ||||
| hsa-miR-29cSZ | UAGCACCAUUUGAAAUCGGU | ||||
| miR-34/449 | 882 | 888 | m8 | hsa-miR-34abrain | UGGCAGUGUCUUAGCUGGUUGUU |
| hsa-miR-34c | AGGCAGUGUAGUUAGCUGAUUGC | ||||
| hsa-miR-449 | UGGCAGUGUAUUGUUAGCUGGU | ||||
| hsa-miR-449b | AGGCAGUGUAUUGUUAGCUGGC | ||||
- SZ: miRNAs which differentially expressed in brain cortex of schizophrenia patients comparing with control samples using microarray. Click here to see the list of SZ related miRNAs.
- Brain: miRNAs which are expressed in brain based on miRNA microarray expression studies. Click here to see the list of brain related miRNAs.