Gene Page: KIAA0141
Summary ?
| GeneID | 9812 |
| Symbol | KIAA0141 |
| Synonyms | DELE |
| Description | KIAA0141 |
| Reference | MIM:615741|HGNC:HGNC:28969|Ensembl:ENSG00000081791|HPRD:13780|Vega:OTTHUMG00000129662 |
| Gene type | protein-coding |
| Map location | 5q31.3 |
| Pascal p-value | 0.03 |
| Sherlock p-value | 1.327E-5 |
| Fetal beta | 0.335 |
| eGene | Myers' cis & trans |
Gene in Data Sources
| Gene set name | Method of gene set | Description | Info |
|---|---|---|---|
| CV:PGCnp | Genome-wide Association Study | GWAS | |
| GSMA_I | Genome scan meta-analysis | Psr: 0.0032 |
Section I. Genetics and epigenetics annotation
 eQTL annotation
| SNP ID | Chromosome | Position | eGene | Gene Entrez ID | pvalue | qvalue | TSS distance | eQTL type |
|---|---|---|---|---|---|---|---|---|
| rs16829545 | chr2 | 151977407 | KIAA0141 | 9812 | 0 | trans |
Section II. Transcriptome annotation
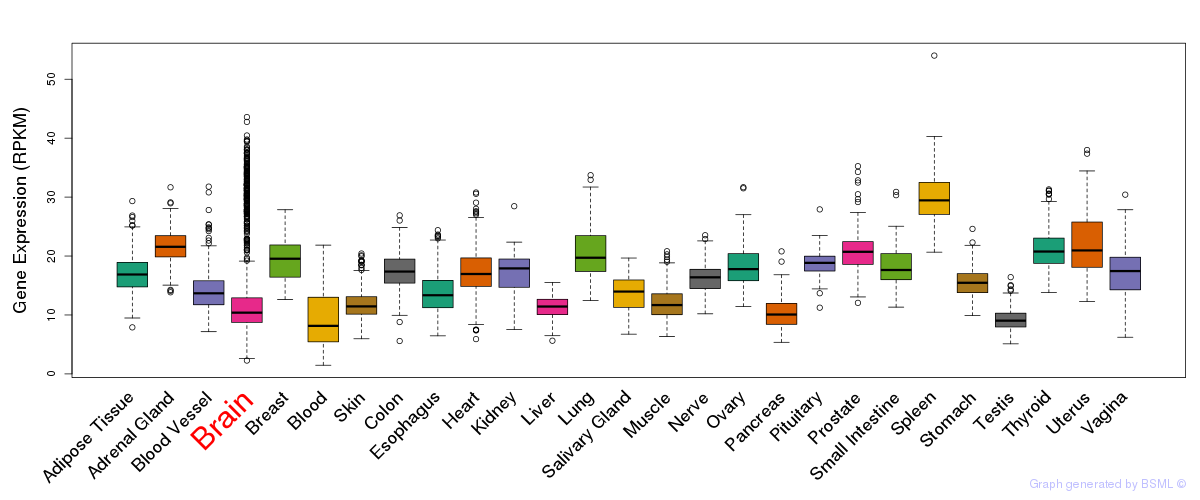
General gene expression (GTEx)

Gene expression during devlopment (BrainCloud)
Footnote:
A total of 269 time points ploted, with n=38 fetal samples (x=1:38). Each triangle represents one time point.
Gene expression of temporal and spatial changes (BrainSpan)
Footnote:
SC: sub-cortical regions; SM: sensory-motor regions; FC: frontal cortex; and TP: temporal-parietal cortex
ST1: fetal (13 - 26 postconception weeks), ST2: early infancy to late childhood (4 months to 11 years), and ST3: adolescence to adulthood (13 - 23 years)
The bar shown representes the lower 25% and upper 25% of the expression distribution.
Top co-expressed genes in brain regions
| Top 10 positively co-expressed genes | ||
| Gene | Pearson's Correlation | Spearman's Correlation |
| DOC2A | 0.79 | 0.84 |
| CCKBR | 0.78 | 0.83 |
| SULT4A1 | 0.77 | 0.83 |
| RND1 | 0.76 | 0.84 |
| NRSN2 | 0.76 | 0.78 |
| GFRA2 | 0.75 | 0.82 |
| CHRM1 | 0.75 | 0.75 |
| CRY2 | 0.74 | 0.77 |
| ANKRD56 | 0.74 | 0.81 |
| ANKRD34A | 0.74 | 0.78 |
| Top 10 negatively co-expressed genes | ||
| Gene | Pearson's Correlation | Spearman's Correlation |
| NSBP1 | -0.44 | -0.53 |
| RAB13 | -0.44 | -0.55 |
| PECI | -0.43 | -0.44 |
| AP002478.3 | -0.41 | -0.45 |
| AF347015.18 | -0.41 | -0.39 |
| C11orf67 | -0.40 | -0.46 |
| C19orf18 | -0.40 | -0.45 |
| AL139819.3 | -0.40 | -0.39 |
| AF347015.21 | -0.39 | -0.31 |
| GPR125 | -0.38 | -0.32 |
Section III. Gene Ontology annotation
| Molecular function | GO term | Evidence | Neuro keywords | PubMed ID |
|---|---|---|---|---|
| GO:0005488 | binding | IEA | - | |
| Cellular component | GO term | Evidence | Neuro keywords | PubMed ID |
| GO:0005739 | mitochondrion | IDA | 10942595 |
Section V. Pathway annotation
| Pathway name | Pathway size | # SZGR 2.0 genes in pathway | Info |
|---|---|---|---|
| PARENT MTOR SIGNALING UP | 567 | 375 | All SZGR 2.0 genes in this pathway |
| NAKAMURA TUMOR ZONE PERIPHERAL VS CENTRAL DN | 634 | 384 | All SZGR 2.0 genes in this pathway |
| PUIFFE INVASION INHIBITED BY ASCITES UP | 82 | 51 | All SZGR 2.0 genes in this pathway |
| WANG LMO4 TARGETS UP | 372 | 227 | All SZGR 2.0 genes in this pathway |
| DODD NASOPHARYNGEAL CARCINOMA UP | 1821 | 933 | All SZGR 2.0 genes in this pathway |
| GALE APL WITH FLT3 MUTATED UP | 56 | 35 | All SZGR 2.0 genes in this pathway |
| ZHAN MULTIPLE MYELOMA HP UP | 49 | 26 | All SZGR 2.0 genes in this pathway |
| HOEGERKORP CD44 TARGETS TEMPORAL DN | 25 | 16 | All SZGR 2.0 genes in this pathway |
| RODWELL AGING KIDNEY NO BLOOD DN | 150 | 93 | All SZGR 2.0 genes in this pathway |
| BROWNE HCMV INFECTION 14HR DN | 298 | 200 | All SZGR 2.0 genes in this pathway |
| WANG CISPLATIN RESPONSE AND XPC DN | 228 | 146 | All SZGR 2.0 genes in this pathway |
| VANTVEER BREAST CANCER ESR1 UP | 167 | 99 | All SZGR 2.0 genes in this pathway |
| ZWANG TRANSIENTLY UP BY 1ST EGF PULSE ONLY | 1839 | 928 | All SZGR 2.0 genes in this pathway |
| ZWANG EGF INTERVAL DN | 214 | 124 | All SZGR 2.0 genes in this pathway |
Section VI. microRNA annotation
| miRNA family | Target position | miRNA ID | miRNA seq | ||
|---|---|---|---|---|---|
| UTR start | UTR end | Match method | |||
| miR-146 | 831 | 837 | 1A | hsa-miR-146a | UGAGAACUGAAUUCCAUGGGUU |
| hsa-miR-146bbrain | UGAGAACUGAAUUCCAUAGGCU | ||||
- SZ: miRNAs which differentially expressed in brain cortex of schizophrenia patients comparing with control samples using microarray. Click here to see the list of SZ related miRNAs.
- Brain: miRNAs which are expressed in brain based on miRNA microarray expression studies. Click here to see the list of brain related miRNAs.