Gene Page: SPATA2
Summary ?
| GeneID | 9825 |
| Symbol | SPATA2 |
| Synonyms | PD1|PPP1R145|tamo |
| Description | spermatogenesis associated 2 |
| Reference | MIM:607662|HGNC:HGNC:14681|Ensembl:ENSG00000158480|HPRD:09636|Vega:OTTHUMG00000032704 |
| Gene type | protein-coding |
| Map location | 20q13.13 |
| Pascal p-value | 0.302 |
| Sherlock p-value | 0.378 |
| Fetal beta | -0.703 |
| DMG | 1 (# studies) |
Gene in Data Sources
| Gene set name | Method of gene set | Description | Info |
|---|---|---|---|
| DMG:Nishioka_2013 | Genome-wide DNA methylation analysis | The authors investigated the methylation profiles of DNA in peripheral blood cells from 18 patients with first-episode schizophrenia (FESZ) and from 15 normal controls. | 1 |
Section I. Genetics and epigenetics annotation
 Differentially methylated gene
| Probe | Chromosome | Position | Nearest gene | P (dis) | Beta (dis) | FDR (dis) | Study |
|---|---|---|---|---|---|---|---|
| cg13210512 | 20 | 48531577 | SPATA2 | -0.025 | 0.8 | DMG:Nishioka_2013 |
Section II. Transcriptome annotation
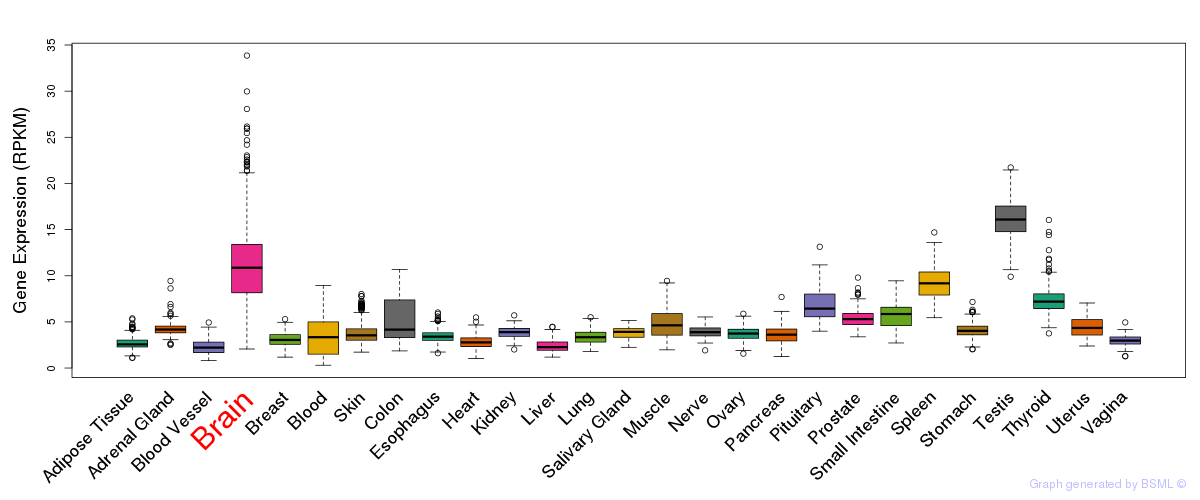
General gene expression (GTEx)
Gene expression during devlopment (BrainCloud)
Footnote:
A total of 269 time points ploted, with n=38 fetal samples (x=1:38). Each triangle represents one time point.
Gene expression of temporal and spatial changes (BrainSpan)
Footnote:
SC: sub-cortical regions; SM: sensory-motor regions; FC: frontal cortex; and TP: temporal-parietal cortex
ST1: fetal (13 - 26 postconception weeks), ST2: early infancy to late childhood (4 months to 11 years), and ST3: adolescence to adulthood (13 - 23 years)
The bar shown representes the lower 25% and upper 25% of the expression distribution.
Top co-expressed genes in brain regions
| Top 10 positively co-expressed genes | ||
| Gene | Pearson's Correlation | Spearman's Correlation |
| AFF4 | 0.97 | 0.98 |
| LATS1 | 0.97 | 0.97 |
| DDX6 | 0.96 | 0.97 |
| NCOA3 | 0.96 | 0.97 |
| RC3H2 | 0.96 | 0.98 |
| IREB2 | 0.96 | 0.96 |
| PUM2 | 0.96 | 0.97 |
| ZNF518B | 0.95 | 0.97 |
| PRKDC | 0.95 | 0.97 |
| PDS5A | 0.95 | 0.97 |
| Top 10 negatively co-expressed genes | ||
| Gene | Pearson's Correlation | Spearman's Correlation |
| FXYD1 | -0.69 | -0.84 |
| AF347015.31 | -0.69 | -0.83 |
| MT-CO2 | -0.68 | -0.84 |
| IFI27 | -0.67 | -0.81 |
| AIFM3 | -0.67 | -0.71 |
| AF347015.33 | -0.66 | -0.79 |
| HIGD1B | -0.66 | -0.83 |
| HSD17B14 | -0.66 | -0.75 |
| AF347015.27 | -0.66 | -0.79 |
| S100B | -0.66 | -0.77 |
Section V. Pathway annotation
| Pathway name | Pathway size | # SZGR 2.0 genes in pathway | Info |
|---|---|---|---|
| OSMAN BLADDER CANCER DN | 406 | 230 | All SZGR 2.0 genes in this pathway |
| TIEN INTESTINE PROBIOTICS 6HR DN | 167 | 100 | All SZGR 2.0 genes in this pathway |
| CONCANNON APOPTOSIS BY EPOXOMICIN UP | 239 | 157 | All SZGR 2.0 genes in this pathway |
| NIKOLSKY BREAST CANCER 20Q12 Q13 AMPLICON | 149 | 76 | All SZGR 2.0 genes in this pathway |
| MITSIADES RESPONSE TO APLIDIN UP | 439 | 257 | All SZGR 2.0 genes in this pathway |
| BONOME OVARIAN CANCER SURVIVAL OPTIMAL DEBULKING | 246 | 152 | All SZGR 2.0 genes in this pathway |
| MILI PSEUDOPODIA HAPTOTAXIS DN | 668 | 419 | All SZGR 2.0 genes in this pathway |
| FEVR CTNNB1 TARGETS UP | 682 | 433 | All SZGR 2.0 genes in this pathway |
| HOLLEMAN VINCRISTINE RESISTANCE B ALL UP | 38 | 22 | All SZGR 2.0 genes in this pathway |
| HOLLEMAN VINCRISTINE RESISTANCE ALL UP | 27 | 16 | All SZGR 2.0 genes in this pathway |
| ZWANG TRANSIENTLY UP BY 1ST EGF PULSE ONLY | 1839 | 928 | All SZGR 2.0 genes in this pathway |