Gene Page: LCMT2
Summary ?
| GeneID | 9836 |
| Symbol | LCMT2 |
| Synonyms | PPM2|TYW4 |
| Description | leucine carboxyl methyltransferase 2 |
| Reference | MIM:611246|HGNC:HGNC:17558|HPRD:17267| |
| Gene type | protein-coding |
| Map location | 15q15.3 |
| Pascal p-value | 0.001 |
| Fetal beta | 1.125 |
| DMG | 1 (# studies) |
Gene in Data Sources
| Gene set name | Method of gene set | Description | Info |
|---|---|---|---|
| CV:PGCnp | Genome-wide Association Study | GWAS | |
| DMG:Jaffe_2016 | Genome-wide DNA methylation analysis | This dataset includes 2,104 probes/CpGs associated with SZ patients (n=108) compared to 136 controls at Bonferroni-adjusted P < 0.05. | 1 |
Section I. Genetics and epigenetics annotation
 Differentially methylated gene
| Probe | Chromosome | Position | Nearest gene | P (dis) | Beta (dis) | FDR (dis) | Study |
|---|---|---|---|---|---|---|---|
| cg25415508 | 15 | 43622652 | LCMT2 | 6.06E-9 | -0.011 | 3.22E-6 | DMG:Jaffe_2016 |
Section II. Transcriptome annotation
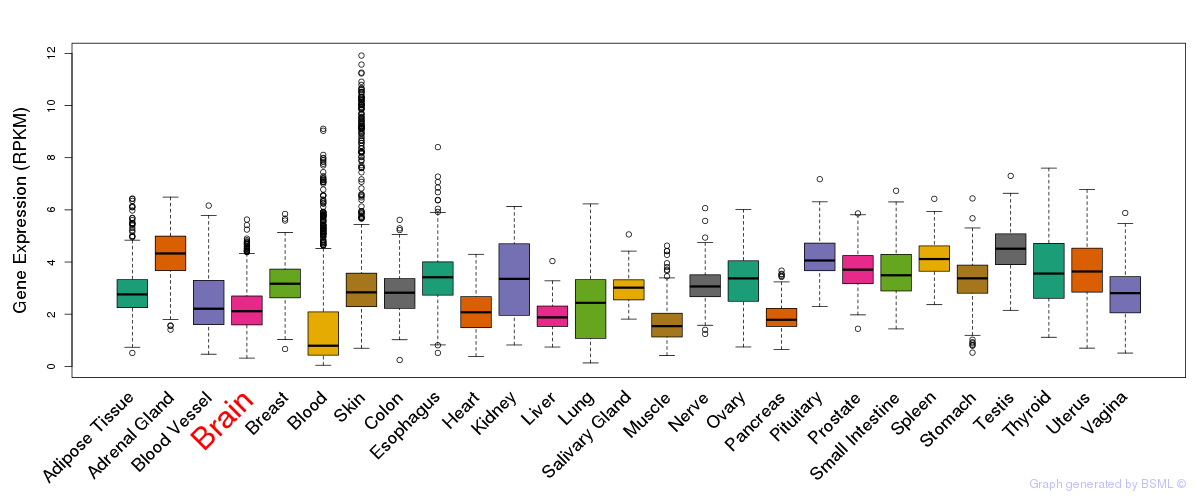
General gene expression (GTEx)
Gene expression during devlopment (BrainCloud)
Footnote:
A total of 269 time points ploted, with n=38 fetal samples (x=1:38). Each triangle represents one time point.
Gene expression of temporal and spatial changes (BrainSpan)
Footnote:
SC: sub-cortical regions; SM: sensory-motor regions; FC: frontal cortex; and TP: temporal-parietal cortex
ST1: fetal (13 - 26 postconception weeks), ST2: early infancy to late childhood (4 months to 11 years), and ST3: adolescence to adulthood (13 - 23 years)
The bar shown representes the lower 25% and upper 25% of the expression distribution.
Top co-expressed genes in brain regions
| Top 10 positively co-expressed genes | ||
| Gene | Pearson's Correlation | Spearman's Correlation |
| FAM117B | 0.94 | 0.96 |
| ASXL3 | 0.93 | 0.94 |
| FAT4 | 0.93 | 0.90 |
| CEP170 | 0.93 | 0.96 |
| EML1 | 0.93 | 0.95 |
| VASH2 | 0.92 | 0.87 |
| TNIK | 0.92 | 0.84 |
| MED13L | 0.92 | 0.95 |
| FAM59A | 0.92 | 0.91 |
| DAB1 | 0.92 | 0.87 |
| Top 10 negatively co-expressed genes | ||
| Gene | Pearson's Correlation | Spearman's Correlation |
| SERPINB6 | -0.68 | -0.76 |
| HEPN1 | -0.66 | -0.78 |
| HSD17B14 | -0.66 | -0.82 |
| TSC22D4 | -0.66 | -0.83 |
| AIFM3 | -0.66 | -0.79 |
| C5orf53 | -0.65 | -0.77 |
| AF347015.31 | -0.65 | -0.91 |
| HLA-F | -0.65 | -0.77 |
| S100B | -0.64 | -0.86 |
| LHPP | -0.64 | -0.63 |
Section V. Pathway annotation
| Pathway name | Pathway size | # SZGR 2.0 genes in pathway | Info |
|---|---|---|---|
| KEGG HISTIDINE METABOLISM | 29 | 19 | All SZGR 2.0 genes in this pathway |
| KEGG TYROSINE METABOLISM | 42 | 30 | All SZGR 2.0 genes in this pathway |
| KEGG SELENOAMINO ACID METABOLISM | 26 | 18 | All SZGR 2.0 genes in this pathway |
| GARY CD5 TARGETS DN | 431 | 263 | All SZGR 2.0 genes in this pathway |
| TSUNODA CISPLATIN RESISTANCE DN | 51 | 38 | All SZGR 2.0 genes in this pathway |
| BUYTAERT PHOTODYNAMIC THERAPY STRESS DN | 637 | 377 | All SZGR 2.0 genes in this pathway |
| BENPORATH NANOG TARGETS | 988 | 594 | All SZGR 2.0 genes in this pathway |
| ONDER CDH1 TARGETS 1 DN | 169 | 102 | All SZGR 2.0 genes in this pathway |
| ACEVEDO LIVER CANCER UP | 973 | 570 | All SZGR 2.0 genes in this pathway |