Gene Page: BANK1
Summary ?
| GeneID | 55024 |
| Symbol | BANK1 |
| Synonyms | BANK |
| Description | B-cell scaffold protein with ankyrin repeats 1 |
| Reference | MIM:610292|HGNC:HGNC:18233|Ensembl:ENSG00000153064|HPRD:09819|Vega:OTTHUMG00000160958 |
| Gene type | protein-coding |
| Map location | 4q24 |
| Pascal p-value | 5.245E-4 |
| Fetal beta | -1.364 |
Gene in Data Sources
| Gene set name | Method of gene set | Description | Info |
|---|---|---|---|
| CV:GWAScat | Genome-wide Association Studies | This data set includes 560 SNPs associated with schizophrenia. A total of 486 genes were mapped to these SNPs within 50kb. | |
| CV:GWASdb | Genome-wide Association Studies | GWASdb records for schizophrenia | |
| CV:PGC128 | Genome-wide Association Study | A multi-stage schizophrenia GWAS of up to 36,989 cases and 113,075 controls. Reported by the Schizophrenia Working Group of PGC. 128 independent associations spanning 108 loci | |
| CV:PGCnp | Genome-wide Association Study | GWAS |
Section I. Genetics and epigenetics annotation
 CV:PGC128
| SNP ID | Chromosome | Position | Allele | P | Function | Gene | Up/Down Distance |
|---|---|---|---|---|---|---|---|
| rs35518360 | chr4 | 103146890 | AT | 9.562E-13 | intergenic | BANK1,SLC39A8 | dist=150921;dist=25308 |
Section II. Transcriptome annotation
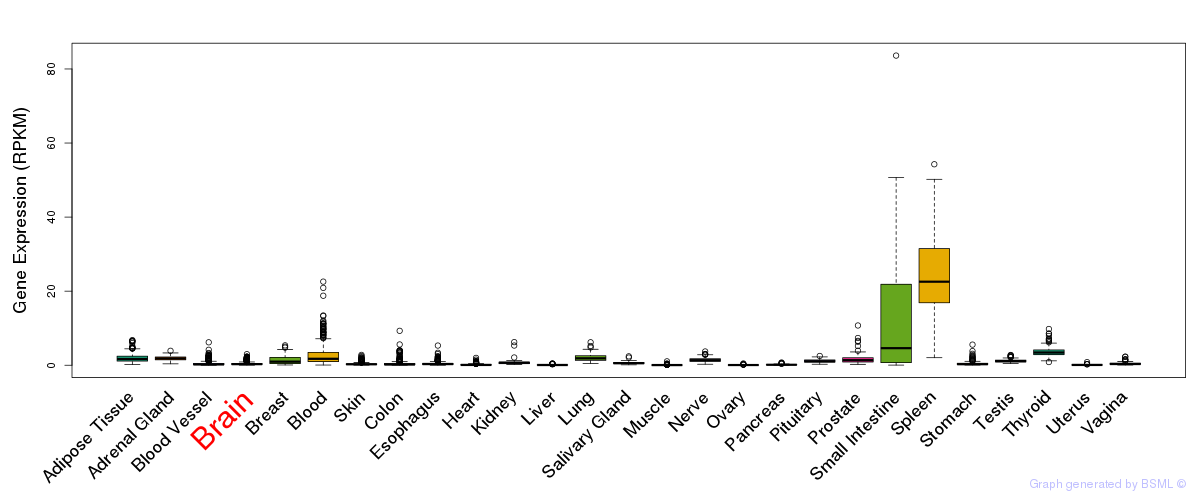
General gene expression (GTEx)
Gene expression during devlopment (BrainCloud)
Footnote:
A total of 269 time points ploted, with n=38 fetal samples (x=1:38). Each triangle represents one time point.
Gene expression of temporal and spatial changes (BrainSpan)
Footnote:
SC: sub-cortical regions; SM: sensory-motor regions; FC: frontal cortex; and TP: temporal-parietal cortex
ST1: fetal (13 - 26 postconception weeks), ST2: early infancy to late childhood (4 months to 11 years), and ST3: adolescence to adulthood (13 - 23 years)
The bar shown representes the lower 25% and upper 25% of the expression distribution.
Top co-expressed genes in brain regions
| Top 10 positively co-expressed genes | ||
| Gene | Pearson's Correlation | Spearman's Correlation |
| RABGGTA | 0.89 | 0.88 |
| ACOT7 | 0.88 | 0.85 |
| RTN2 | 0.88 | 0.90 |
| MAP2K2 | 0.87 | 0.84 |
| ST3GAL3 | 0.87 | 0.85 |
| EGLN2 | 0.86 | 0.87 |
| FAM69B | 0.86 | 0.88 |
| MPND | 0.85 | 0.88 |
| ANKRD13D | 0.85 | 0.86 |
| C7orf43 | 0.85 | 0.86 |
| Top 10 negatively co-expressed genes | ||
| Gene | Pearson's Correlation | Spearman's Correlation |
| AF347015.27 | -0.69 | -0.70 |
| AF347015.8 | -0.69 | -0.68 |
| AF347015.31 | -0.67 | -0.65 |
| AF347015.33 | -0.67 | -0.66 |
| AF347015.2 | -0.67 | -0.65 |
| MT-CYB | -0.67 | -0.67 |
| MT-CO2 | -0.67 | -0.64 |
| AF347015.15 | -0.66 | -0.65 |
| AF347015.26 | -0.65 | -0.66 |
| MT-ATP8 | -0.64 | -0.72 |
Section V. Pathway annotation
| Pathway name | Pathway size | # SZGR 2.0 genes in pathway | Info |
|---|---|---|---|
| SENGUPTA NASOPHARYNGEAL CARCINOMA DN | 349 | 157 | All SZGR 2.0 genes in this pathway |
| HUTTMANN B CLL POOR SURVIVAL DN | 60 | 39 | All SZGR 2.0 genes in this pathway |
| RODRIGUES THYROID CARCINOMA ANAPLASTIC DN | 537 | 339 | All SZGR 2.0 genes in this pathway |
| NUYTTEN EZH2 TARGETS UP | 1037 | 673 | All SZGR 2.0 genes in this pathway |
| PASQUALUCCI LYMPHOMA BY GC STAGE DN | 165 | 104 | All SZGR 2.0 genes in this pathway |
| ZHAN MULTIPLE MYELOMA CD1 AND CD2 UP | 89 | 51 | All SZGR 2.0 genes in this pathway |
| HADDAD B LYMPHOCYTE PROGENITOR | 293 | 193 | All SZGR 2.0 genes in this pathway |
| ALCALAY AML BY NPM1 LOCALIZATION DN | 184 | 132 | All SZGR 2.0 genes in this pathway |
| VERHAAK AML WITH NPM1 MUTATED DN | 246 | 180 | All SZGR 2.0 genes in this pathway |
| SMID BREAST CANCER LUMINAL B DN | 564 | 326 | All SZGR 2.0 genes in this pathway |
| SMID BREAST CANCER NORMAL LIKE UP | 476 | 285 | All SZGR 2.0 genes in this pathway |
| POOLA INVASIVE BREAST CANCER UP | 288 | 168 | All SZGR 2.0 genes in this pathway |
| WIERENGA STAT5A TARGETS DN | 213 | 127 | All SZGR 2.0 genes in this pathway |
| ACEVEDO FGFR1 TARGETS IN PROSTATE CANCER MODEL DN | 308 | 187 | All SZGR 2.0 genes in this pathway |