Gene Page: GDF11
Summary ?
| GeneID | 10220 |
| Symbol | GDF11 |
| Synonyms | BMP-11|BMP11 |
| Description | growth differentiation factor 11 |
| Reference | MIM:603936|HGNC:HGNC:4216|Ensembl:ENSG00000135414|HPRD:04895|Vega:OTTHUMG00000170188 |
| Gene type | protein-coding |
| Map location | 12q13.2 |
| Pascal p-value | 0.546 |
| Fetal beta | 0.035 |
| DMG | 1 (# studies) |
Gene in Data Sources
| Gene set name | Method of gene set | Description | Info |
|---|---|---|---|
| CV:PGCnp | Genome-wide Association Study | GWAS | |
| DMG:Jaffe_2016 | Genome-wide DNA methylation analysis | This dataset includes 2,104 probes/CpGs associated with SZ patients (n=108) compared to 136 controls at Bonferroni-adjusted P < 0.05. | 1 |
| GO_Annotation | Mapping neuro-related keywords to Gene Ontology annotations | Hits with neuro-related keywords: 1 |
Section I. Genetics and epigenetics annotation
 Differentially methylated gene
| Probe | Chromosome | Position | Nearest gene | P (dis) | Beta (dis) | FDR (dis) | Study |
|---|---|---|---|---|---|---|---|
| cg15466281 | 12 | 56137783 | GDF11 | 2.15E-9 | -0.023 | 1.69E-6 | DMG:Jaffe_2016 |
Section II. Transcriptome annotation
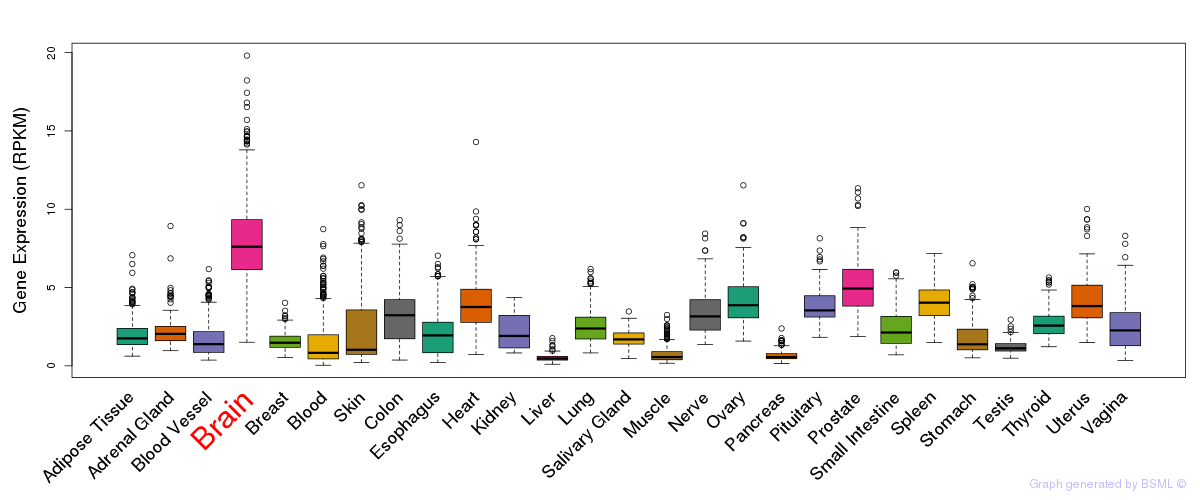
General gene expression (GTEx)
Gene expression during devlopment (BrainCloud)
Footnote:
A total of 269 time points ploted, with n=38 fetal samples (x=1:38). Each triangle represents one time point.
Gene expression of temporal and spatial changes (BrainSpan)
Footnote:
SC: sub-cortical regions; SM: sensory-motor regions; FC: frontal cortex; and TP: temporal-parietal cortex
ST1: fetal (13 - 26 postconception weeks), ST2: early infancy to late childhood (4 months to 11 years), and ST3: adolescence to adulthood (13 - 23 years)
The bar shown representes the lower 25% and upper 25% of the expression distribution.
Top co-expressed genes in brain regions
| Top 10 positively co-expressed genes | ||
| Gene | Pearson's Correlation | Spearman's Correlation |
| CUL1 | 0.89 | 0.89 |
| GRB2 | 0.89 | 0.88 |
| EXOC1 | 0.89 | 0.88 |
| OGFOD1 | 0.88 | 0.88 |
| NPEPPS | 0.88 | 0.88 |
| ZNF174 | 0.88 | 0.87 |
| PREP | 0.88 | 0.88 |
| NHEDC2 | 0.88 | 0.85 |
| GOLGA5 | 0.87 | 0.88 |
| EIF2AK1 | 0.87 | 0.86 |
| Top 10 negatively co-expressed genes | ||
| Gene | Pearson's Correlation | Spearman's Correlation |
| MT-CO2 | -0.82 | -0.79 |
| AF347015.31 | -0.82 | -0.80 |
| AF347015.8 | -0.80 | -0.78 |
| AF347015.21 | -0.79 | -0.79 |
| AF347015.2 | -0.79 | -0.80 |
| MT-CYB | -0.79 | -0.76 |
| AF347015.33 | -0.79 | -0.77 |
| AF347015.27 | -0.78 | -0.78 |
| HIGD1B | -0.76 | -0.76 |
| AF347015.15 | -0.76 | -0.77 |
Section III. Gene Ontology annotation
| Molecular function | GO term | Evidence | Neuro keywords | PubMed ID |
|---|---|---|---|---|
| GO:0005125 | cytokine activity | NAS | - | |
| GO:0005515 | protein binding | IEA | - | |
| GO:0008083 | growth factor activity | IEA | - | |
| Biological process | GO term | Evidence | Neuro keywords | PubMed ID |
| GO:0007399 | nervous system development | TAS | neurite (GO term level: 5) | 10075854 |
| GO:0001501 | skeletal system development | TAS | 10391213 | |
| GO:0001657 | ureteric bud development | IEA | - | |
| GO:0009887 | organ morphogenesis | IEA | - | |
| GO:0008285 | negative regulation of cell proliferation | IEA | - | |
| GO:0048469 | cell maturation | IEA | - | |
| GO:0007498 | mesoderm development | TAS | 10075854 | |
| GO:0031016 | pancreas development | IEA | - | |
| GO:0040007 | growth | IEA | - | |
| GO:0045596 | negative regulation of cell differentiation | IEA | - | |
| GO:0048593 | camera-type eye morphogenesis | IEA | - | |
| Cellular component | GO term | Evidence | Neuro keywords | PubMed ID |
| GO:0005576 | extracellular region | IEA | - | |
| GO:0005615 | extracellular space | IEA | - |
Section V. Pathway annotation
| Pathway name | Pathway size | # SZGR 2.0 genes in pathway | Info |
|---|---|---|---|
| NAKAMURA TUMOR ZONE PERIPHERAL VS CENTRAL UP | 285 | 181 | All SZGR 2.0 genes in this pathway |
| ZHONG RESPONSE TO AZACITIDINE AND TSA UP | 183 | 119 | All SZGR 2.0 genes in this pathway |
| DIAZ CHRONIC MEYLOGENOUS LEUKEMIA UP | 1382 | 904 | All SZGR 2.0 genes in this pathway |
| OKUMURA INFLAMMATORY RESPONSE LPS | 183 | 115 | All SZGR 2.0 genes in this pathway |
| BROWNE HCMV INFECTION 48HR DN | 504 | 323 | All SZGR 2.0 genes in this pathway |
| DOUGLAS BMI1 TARGETS UP | 566 | 371 | All SZGR 2.0 genes in this pathway |
| KYNG DNA DAMAGE BY UV | 62 | 43 | All SZGR 2.0 genes in this pathway |
| KYNG DNA DAMAGE UP | 226 | 164 | All SZGR 2.0 genes in this pathway |
| TAVAZOIE METASTASIS | 108 | 68 | All SZGR 2.0 genes in this pathway |
| BROWNE HCMV INFECTION 1HR DN | 222 | 147 | All SZGR 2.0 genes in this pathway |
| PURBEY TARGETS OF CTBP1 NOT SATB1 DN | 448 | 282 | All SZGR 2.0 genes in this pathway |
| GOBERT OLIGODENDROCYTE DIFFERENTIATION DN | 1080 | 713 | All SZGR 2.0 genes in this pathway |
| RATTENBACHER BOUND BY CELF1 | 467 | 251 | All SZGR 2.0 genes in this pathway |
| NABA SECRETED FACTORS | 344 | 197 | All SZGR 2.0 genes in this pathway |
| NABA MATRISOME ASSOCIATED | 753 | 411 | All SZGR 2.0 genes in this pathway |
| NABA MATRISOME | 1028 | 559 | All SZGR 2.0 genes in this pathway |
Section VI. microRNA annotation
| miRNA family | Target position | miRNA ID | miRNA seq | ||
|---|---|---|---|---|---|
| UTR start | UTR end | Match method | |||
| miR-25/32/92/363/367 | 130 | 137 | 1A,m8 | hsa-miR-25brain | CAUUGCACUUGUCUCGGUCUGA |
| hsa-miR-32 | UAUUGCACAUUACUAAGUUGC | ||||
| hsa-miR-92 | UAUUGCACUUGUCCCGGCCUG | ||||
| hsa-miR-367 | AAUUGCACUUUAGCAAUGGUGA | ||||
| hsa-miR-92bSZ | UAUUGCACUCGUCCCGGCCUC | ||||
- SZ: miRNAs which differentially expressed in brain cortex of schizophrenia patients comparing with control samples using microarray. Click here to see the list of SZ related miRNAs.
- Brain: miRNAs which are expressed in brain based on miRNA microarray expression studies. Click here to see the list of brain related miRNAs.