Gene Page: COQ7
Summary ?
| GeneID | 10229 |
| Symbol | COQ7 |
| Synonyms | CAT5|CLK-1|CLK1|COQ10D8 |
| Description | coenzyme Q7 homolog, ubiquinone (yeast) |
| Reference | MIM:601683|HGNC:HGNC:2244|Ensembl:ENSG00000167186|HPRD:03401|Vega:OTTHUMG00000131455 |
| Gene type | protein-coding |
| Map location | 16p12.3 |
| Pascal p-value | 0.385 |
| Fetal beta | 0.005 |
| DMG | 1 (# studies) |
Gene in Data Sources
| Gene set name | Method of gene set | Description | Info |
|---|---|---|---|
| CV:PGCnp | Genome-wide Association Study | GWAS | |
| DMG:Jaffe_2016 | Genome-wide DNA methylation analysis | This dataset includes 2,104 probes/CpGs associated with SZ patients (n=108) compared to 136 controls at Bonferroni-adjusted P < 0.05. | 1 |
| GSMA_IIE | Genome scan meta-analysis (European-ancestry samples) | Psr: 0.01775 |
Section I. Genetics and epigenetics annotation
 Differentially methylated gene
| Probe | Chromosome | Position | Nearest gene | P (dis) | Beta (dis) | FDR (dis) | Study |
|---|---|---|---|---|---|---|---|
| cg27054524 | 16 | 19097807 | COQ7 | 3.89E-8 | -0.007 | 1.11E-5 | DMG:Jaffe_2016 |
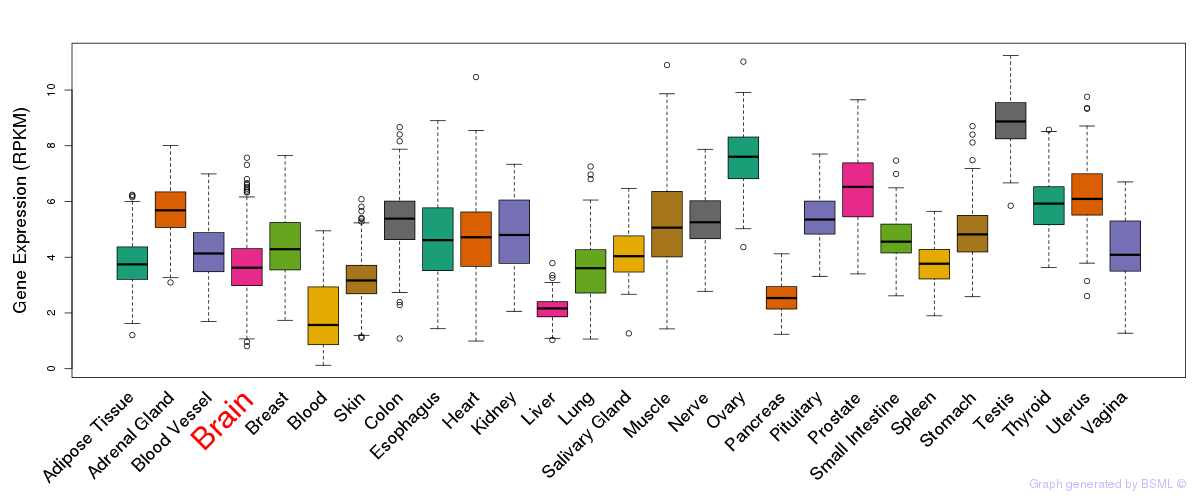
Section II. Transcriptome annotation
General gene expression (GTEx)
Gene expression during devlopment (BrainCloud)
Footnote:
A total of 269 time points ploted, with n=38 fetal samples (x=1:38). Each triangle represents one time point.
Gene expression of temporal and spatial changes (BrainSpan)
Footnote:
SC: sub-cortical regions; SM: sensory-motor regions; FC: frontal cortex; and TP: temporal-parietal cortex
ST1: fetal (13 - 26 postconception weeks), ST2: early infancy to late childhood (4 months to 11 years), and ST3: adolescence to adulthood (13 - 23 years)
The bar shown representes the lower 25% and upper 25% of the expression distribution.
Top co-expressed genes in brain regions
| Top 10 positively co-expressed genes | ||
| Gene | Pearson's Correlation | Spearman's Correlation |
| FIBP | 0.80 | 0.79 |
| UCHL1 | 0.80 | 0.75 |
| AC011479.2 | 0.80 | 0.76 |
| C19orf62 | 0.79 | 0.80 |
| ARPC4 | 0.79 | 0.77 |
| RRAGA | 0.79 | 0.74 |
| PMM1 | 0.79 | 0.81 |
| MANBAL | 0.79 | 0.80 |
| STOML1 | 0.79 | 0.78 |
| TSFM | 0.78 | 0.77 |
| Top 10 negatively co-expressed genes | ||
| Gene | Pearson's Correlation | Spearman's Correlation |
| AF347015.18 | -0.59 | -0.47 |
| AF347015.26 | -0.58 | -0.43 |
| AF347015.8 | -0.55 | -0.38 |
| AF347015.2 | -0.55 | -0.38 |
| AF347015.33 | -0.53 | -0.39 |
| AF347015.15 | -0.52 | -0.37 |
| MT-CO2 | -0.52 | -0.35 |
| MT-ATP8 | -0.52 | -0.38 |
| MT-CYB | -0.51 | -0.37 |
| C10orf108 | -0.50 | -0.50 |
Section III. Gene Ontology annotation
| Molecular function | GO term | Evidence | Neuro keywords | PubMed ID |
|---|---|---|---|---|
| GO:0005506 | iron ion binding | IEA | - | |
| GO:0016491 | oxidoreductase activity | IEA | - | |
| Biological process | GO term | Evidence | Neuro keywords | PubMed ID |
| GO:0006744 | ubiquinone biosynthetic process | TAS | 10501970 | |
| GO:0019538 | protein metabolic process | IEA | - | |
| Cellular component | GO term | Evidence | Neuro keywords | PubMed ID |
| GO:0005634 | nucleus | IDA | 11256614 | |
| GO:0005739 | mitochondrion | TAS | 10501970 |
Section V. Pathway annotation
| Pathway name | Pathway size | # SZGR 2.0 genes in pathway | Info |
|---|---|---|---|
| BERENJENO TRANSFORMED BY RHOA UP | 536 | 340 | All SZGR 2.0 genes in this pathway |
| YANG BREAST CANCER ESR1 LASER UP | 34 | 25 | All SZGR 2.0 genes in this pathway |
| BLALOCK ALZHEIMERS DISEASE UP | 1691 | 1088 | All SZGR 2.0 genes in this pathway |
| LEIN PONS MARKERS | 89 | 59 | All SZGR 2.0 genes in this pathway |
| SMID BREAST CANCER BASAL DN | 701 | 446 | All SZGR 2.0 genes in this pathway |
| MOOTHA HUMAN MITODB 6 2002 | 429 | 260 | All SZGR 2.0 genes in this pathway |
| MOOTHA MITOCHONDRIA | 447 | 277 | All SZGR 2.0 genes in this pathway |
| YOSHIMURA MAPK8 TARGETS UP | 1305 | 895 | All SZGR 2.0 genes in this pathway |
| YAO TEMPORAL RESPONSE TO PROGESTERONE CLUSTER 17 | 181 | 101 | All SZGR 2.0 genes in this pathway |
| BRUINS UVC RESPONSE LATE | 1137 | 655 | All SZGR 2.0 genes in this pathway |
| LEE BMP2 TARGETS DN | 882 | 538 | All SZGR 2.0 genes in this pathway |