Gene Page: UBE4B
Summary ?
| GeneID | 10277 |
| Symbol | UBE4B |
| Synonyms | E4|HDNB1|UBOX3|UFD2|UFD2A |
| Description | ubiquitination factor E4B |
| Reference | MIM:613565|HGNC:HGNC:12500|Ensembl:ENSG00000130939|HPRD:11659|Vega:OTTHUMG00000001797 |
| Gene type | protein-coding |
| Map location | 1p36.3 |
| Pascal p-value | 0.466 |
| Sherlock p-value | 0.312 |
| Fetal beta | 0.114 |
| DMG | 1 (# studies) |
| eGene | Myers' cis & trans |
Gene in Data Sources
| Gene set name | Method of gene set | Description | Info |
|---|---|---|---|
| CV:PGCnp | Genome-wide Association Study | GWAS | |
| DMG:Jaffe_2016 | Genome-wide DNA methylation analysis | This dataset includes 2,104 probes/CpGs associated with SZ patients (n=108) compared to 136 controls at Bonferroni-adjusted P < 0.05. | 1 |
Section I. Genetics and epigenetics annotation
 Differentially methylated gene
| Probe | Chromosome | Position | Nearest gene | P (dis) | Beta (dis) | FDR (dis) | Study |
|---|---|---|---|---|---|---|---|
| cg23036426 | 1 | 10093530 | UBE4B | 9.35E-8 | -0.01 | 2.12E-5 | DMG:Jaffe_2016 |
eQTL annotation
| SNP ID | Chromosome | Position | eGene | Gene Entrez ID | pvalue | qvalue | TSS distance | eQTL type |
|---|---|---|---|---|---|---|---|---|
| rs17377443 | chr1 | 9368135 | UBE4B | 10277 | 0.09 | cis |
Section II. Transcriptome annotation
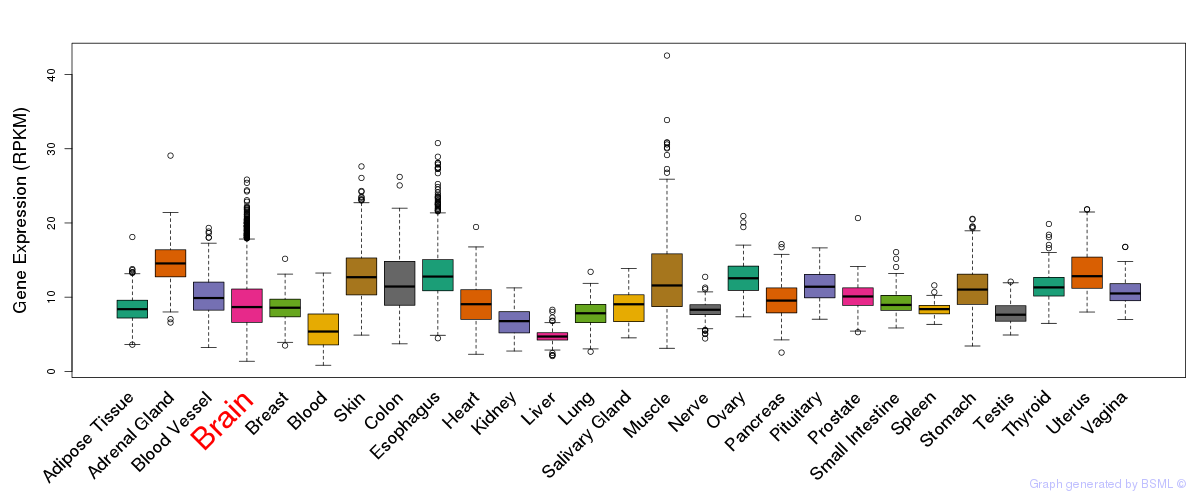
General gene expression (GTEx)
Gene expression during devlopment (BrainCloud)
Footnote:
A total of 269 time points ploted, with n=38 fetal samples (x=1:38). Each triangle represents one time point.
Gene expression of temporal and spatial changes (BrainSpan)
Footnote:
SC: sub-cortical regions; SM: sensory-motor regions; FC: frontal cortex; and TP: temporal-parietal cortex
ST1: fetal (13 - 26 postconception weeks), ST2: early infancy to late childhood (4 months to 11 years), and ST3: adolescence to adulthood (13 - 23 years)
The bar shown representes the lower 25% and upper 25% of the expression distribution.
Top co-expressed genes in brain regions
| Top 10 positively co-expressed genes | ||
| Gene | Pearson's Correlation | Spearman's Correlation |
| BCL2L1 | 0.78 | 0.80 |
| FAM98B | 0.77 | 0.85 |
| ARIH1 | 0.76 | 0.84 |
| UTP3 | 0.76 | 0.83 |
| ACBD3 | 0.75 | 0.82 |
| CCDC43 | 0.75 | 0.81 |
| CYB5B | 0.74 | 0.72 |
| C4orf3 | 0.74 | 0.73 |
| HNRNPUL2 | 0.74 | 0.79 |
| L29074.1 | 0.74 | 0.74 |
| Top 10 negatively co-expressed genes | ||
| Gene | Pearson's Correlation | Spearman's Correlation |
| FXYD1 | -0.58 | -0.65 |
| AF347015.31 | -0.57 | -0.65 |
| MT-CO2 | -0.56 | -0.63 |
| ENHO | -0.56 | -0.70 |
| TLCD1 | -0.55 | -0.64 |
| HIGD1B | -0.55 | -0.67 |
| IFI27 | -0.55 | -0.65 |
| TSC22D4 | -0.53 | -0.62 |
| MYL3 | -0.53 | -0.64 |
| C1orf54 | -0.53 | -0.62 |
Section V. Pathway annotation
| Pathway name | Pathway size | # SZGR 2.0 genes in pathway | Info |
|---|---|---|---|
| KEGG UBIQUITIN MEDIATED PROTEOLYSIS | 138 | 98 | All SZGR 2.0 genes in this pathway |
| PID P73PATHWAY | 79 | 59 | All SZGR 2.0 genes in this pathway |
| PARENT MTOR SIGNALING UP | 567 | 375 | All SZGR 2.0 genes in this pathway |
| WATANABE RECTAL CANCER RADIOTHERAPY RESPONSIVE UP | 108 | 67 | All SZGR 2.0 genes in this pathway |
| DIAZ CHRONIC MEYLOGENOUS LEUKEMIA UP | 1382 | 904 | All SZGR 2.0 genes in this pathway |
| DOANE RESPONSE TO ANDROGEN UP | 184 | 125 | All SZGR 2.0 genes in this pathway |
| KINSEY TARGETS OF EWSR1 FLII FUSION UP | 1278 | 748 | All SZGR 2.0 genes in this pathway |
| GRAESSMANN APOPTOSIS BY DOXORUBICIN DN | 1781 | 1082 | All SZGR 2.0 genes in this pathway |
| DARWICHE SKIN TUMOR PROMOTER DN | 185 | 115 | All SZGR 2.0 genes in this pathway |
| DARWICHE PAPILLOMA RISK LOW DN | 165 | 107 | All SZGR 2.0 genes in this pathway |
| DARWICHE PAPILLOMA RISK HIGH DN | 180 | 110 | All SZGR 2.0 genes in this pathway |
| DARWICHE SQUAMOUS CELL CARCINOMA DN | 181 | 107 | All SZGR 2.0 genes in this pathway |
| LASTOWSKA NEUROBLASTOMA COPY NUMBER DN | 800 | 473 | All SZGR 2.0 genes in this pathway |
| GROSS HYPOXIA VIA HIF1A UP | 77 | 49 | All SZGR 2.0 genes in this pathway |
| AMIT EGF RESPONSE 40 HELA | 42 | 29 | All SZGR 2.0 genes in this pathway |
| WONG IFNA2 RESISTANCE UP | 16 | 10 | All SZGR 2.0 genes in this pathway |
| DOUGLAS BMI1 TARGETS DN | 314 | 188 | All SZGR 2.0 genes in this pathway |
| FUJII YBX1 TARGETS DN | 202 | 132 | All SZGR 2.0 genes in this pathway |
| ACEVEDO LIVER TUMOR VS NORMAL ADJACENT TISSUE UP | 863 | 514 | All SZGR 2.0 genes in this pathway |
| BONCI TARGETS OF MIR15A AND MIR16 1 | 91 | 75 | All SZGR 2.0 genes in this pathway |
| RAY TUMORIGENESIS BY ERBB2 CDC25A DN | 159 | 105 | All SZGR 2.0 genes in this pathway |
| PURBEY TARGETS OF CTBP1 NOT SATB1 DN | 448 | 282 | All SZGR 2.0 genes in this pathway |
| WAKABAYASHI ADIPOGENESIS PPARG RXRA BOUND 8D | 882 | 506 | All SZGR 2.0 genes in this pathway |