Gene Page: DSCR3
Summary ?
| GeneID | 10311 |
| Symbol | DSCR3 |
| Synonyms | DCRA|DSCRA |
| Description | DSCR3 arrestin fold containing |
| Reference | MIM:605298|HGNC:HGNC:3044|Ensembl:ENSG00000157538|HPRD:10390|Vega:OTTHUMG00000086659 |
| Gene type | protein-coding |
| Map location | 21q22.2 |
| Pascal p-value | 0.456 |
| Sherlock p-value | 0.119 |
| Fetal beta | 0.201 |
| DMG | 2 (# studies) |
Gene in Data Sources
| Gene set name | Method of gene set | Description | Info |
|---|---|---|---|
| CV:PGCnp | Genome-wide Association Study | GWAS | |
| DMG:Jaffe_2016 | Genome-wide DNA methylation analysis | This dataset includes 2,104 probes/CpGs associated with SZ patients (n=108) compared to 136 controls at Bonferroni-adjusted P < 0.05. | 2 |
| DMG:Wockner_2014 | Genome-wide DNA methylation analysis | This dataset includes 4641 differentially methylated probes corresponding to 2929 unique genes between schizophrenia patients (n=24) and controls (n=24). | 2 |
Section I. Genetics and epigenetics annotation
 Differentially methylated gene
| Probe | Chromosome | Position | Nearest gene | P (dis) | Beta (dis) | FDR (dis) | Study |
|---|---|---|---|---|---|---|---|
| cg02532999 | 21 | 38639929 | DSCR3 | 5.555E-4 | -0.648 | 0.049 | DMG:Wockner_2014 |
| cg02747044 | 21 | 38639544 | DSCR3 | 7.28E-8 | -0.008 | 1.74E-5 | DMG:Jaffe_2016 |
Section II. Transcriptome annotation
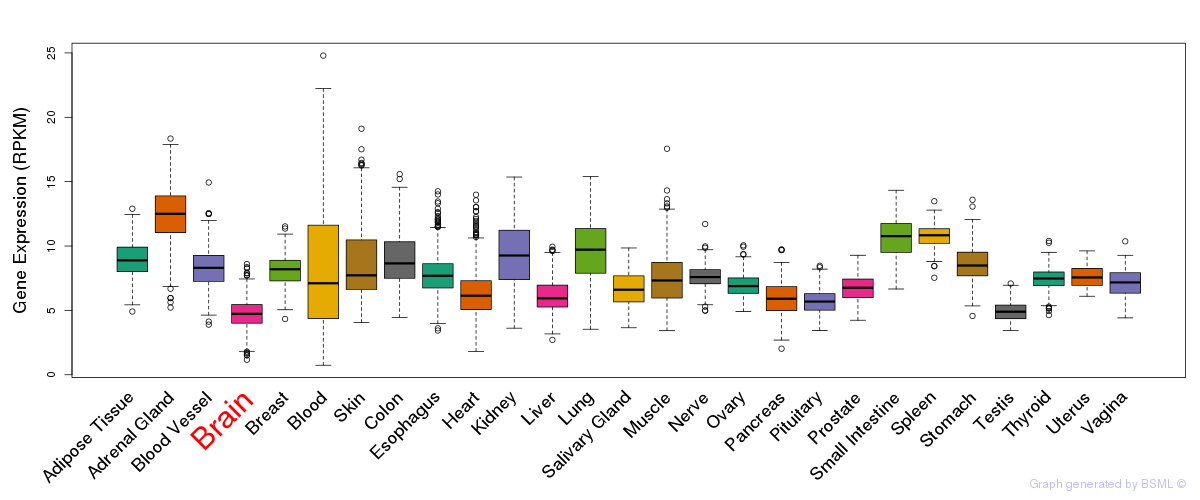
General gene expression (GTEx)
Gene expression during devlopment (BrainCloud)
Footnote:
A total of 269 time points ploted, with n=38 fetal samples (x=1:38). Each triangle represents one time point.
Gene expression of temporal and spatial changes (BrainSpan)
Footnote:
SC: sub-cortical regions; SM: sensory-motor regions; FC: frontal cortex; and TP: temporal-parietal cortex
ST1: fetal (13 - 26 postconception weeks), ST2: early infancy to late childhood (4 months to 11 years), and ST3: adolescence to adulthood (13 - 23 years)
The bar shown representes the lower 25% and upper 25% of the expression distribution.
Top co-expressed genes in brain regions
| Top 10 positively co-expressed genes | ||
| Gene | Pearson's Correlation | Spearman's Correlation |
| PDE2A | 0.88 | 0.88 |
| BAI2 | 0.86 | 0.87 |
| IQSEC2 | 0.85 | 0.87 |
| DUSP7 | 0.85 | 0.86 |
| CACNB1 | 0.85 | 0.86 |
| ZER1 | 0.85 | 0.83 |
| JPH3 | 0.84 | 0.85 |
| MAN2B2 | 0.83 | 0.81 |
| RAPGEFL1 | 0.83 | 0.83 |
| ABR | 0.83 | 0.83 |
| Top 10 negatively co-expressed genes | ||
| Gene | Pearson's Correlation | Spearman's Correlation |
| DBI | -0.52 | -0.56 |
| AF347015.21 | -0.50 | -0.41 |
| GNG11 | -0.49 | -0.49 |
| C1orf54 | -0.49 | -0.50 |
| AP002478.3 | -0.48 | -0.47 |
| MYL12A | -0.47 | -0.52 |
| NOSTRIN | -0.45 | -0.41 |
| AF347015.18 | -0.44 | -0.35 |
| RAB13 | -0.44 | -0.50 |
| RAB34 | -0.43 | -0.48 |
Section V. Pathway annotation
| Pathway name | Pathway size | # SZGR 2.0 genes in pathway | Info |
|---|---|---|---|
| DIAZ CHRONIC MEYLOGENOUS LEUKEMIA UP | 1382 | 904 | All SZGR 2.0 genes in this pathway |
| RODRIGUES THYROID CARCINOMA ANAPLASTIC UP | 722 | 443 | All SZGR 2.0 genes in this pathway |
| ENK UV RESPONSE KERATINOCYTE DN | 485 | 334 | All SZGR 2.0 genes in this pathway |
| CHIARADONNA NEOPLASTIC TRANSFORMATION CDC25 DN | 153 | 100 | All SZGR 2.0 genes in this pathway |
| SCHLOSSER SERUM RESPONSE DN | 712 | 443 | All SZGR 2.0 genes in this pathway |
| SPIELMAN LYMPHOBLAST EUROPEAN VS ASIAN DN | 584 | 395 | All SZGR 2.0 genes in this pathway |
| NADLER HYPERGLYCEMIA AT OBESITY | 58 | 35 | All SZGR 2.0 genes in this pathway |
| MARSON BOUND BY FOXP3 STIMULATED | 1022 | 619 | All SZGR 2.0 genes in this pathway |
| STEIN ESRRA TARGETS UP | 388 | 234 | All SZGR 2.0 genes in this pathway |
| LIN NPAS4 TARGETS UP | 163 | 100 | All SZGR 2.0 genes in this pathway |
| STEIN ESRRA TARGETS | 535 | 325 | All SZGR 2.0 genes in this pathway |
| BRUINS UVC RESPONSE LATE | 1137 | 655 | All SZGR 2.0 genes in this pathway |
| WAKABAYASHI ADIPOGENESIS PPARG RXRA BOUND 8D | 882 | 506 | All SZGR 2.0 genes in this pathway |
| KRIEG HYPOXIA NOT VIA KDM3A | 770 | 480 | All SZGR 2.0 genes in this pathway |