Gene Page: ZER1
Summary ?
| GeneID | 10444 |
| Symbol | ZER1 |
| Synonyms | C9orf60|ZYG|ZYG11BL |
| Description | zyg-11 related, cell cycle regulator |
| Reference | HGNC:HGNC:30960|Ensembl:ENSG00000160445|HPRD:10802|Vega:OTTHUMG00000020759 |
| Gene type | protein-coding |
| Map location | 9q34.11 |
| Pascal p-value | 4.134E-5 |
| Sherlock p-value | 0.01 |
| Fetal beta | -0.66 |
| eGene | Myers' cis & trans |
| Support | CompositeSet Darnell FMRP targets |
Gene in Data Sources
| Gene set name | Method of gene set | Description | Info |
|---|---|---|---|
| CV:PGCnp | Genome-wide Association Study | GWAS |
Section I. Genetics and epigenetics annotation
 eQTL annotation
| SNP ID | Chromosome | Position | eGene | Gene Entrez ID | pvalue | qvalue | TSS distance | eQTL type |
|---|---|---|---|---|---|---|---|---|
| rs2088626 | chr5 | 10459554 | ZER1 | 10444 | 0.19 | trans |
Section II. Transcriptome annotation
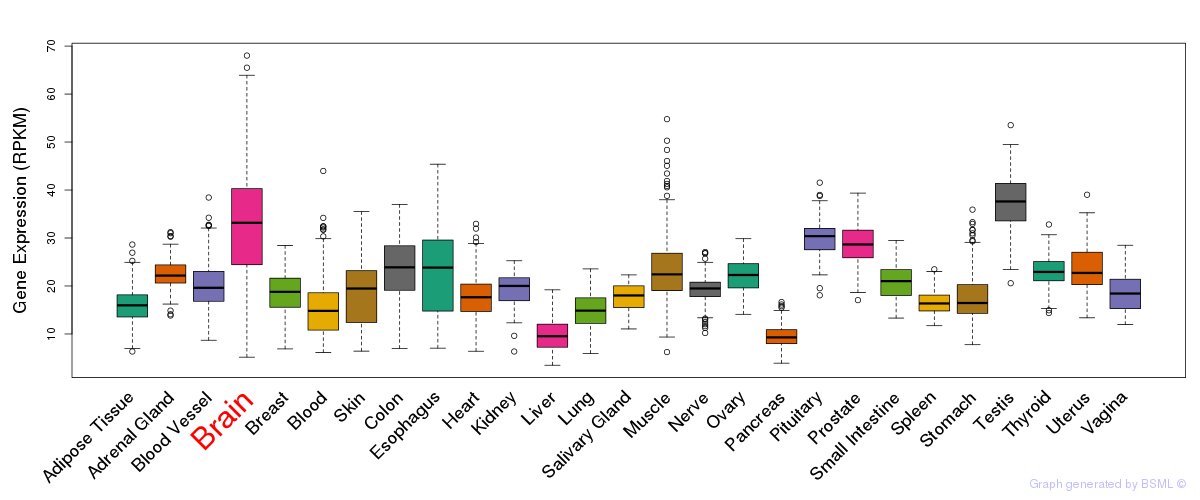
General gene expression (GTEx)

Gene expression during devlopment (BrainCloud)
Footnote:
A total of 269 time points ploted, with n=38 fetal samples (x=1:38). Each triangle represents one time point.
Gene expression of temporal and spatial changes (BrainSpan)
Footnote:
SC: sub-cortical regions; SM: sensory-motor regions; FC: frontal cortex; and TP: temporal-parietal cortex
ST1: fetal (13 - 26 postconception weeks), ST2: early infancy to late childhood (4 months to 11 years), and ST3: adolescence to adulthood (13 - 23 years)
The bar shown representes the lower 25% and upper 25% of the expression distribution.
Top co-expressed genes in brain regions
| Top 10 positively co-expressed genes | ||
| Gene | Pearson's Correlation | Spearman's Correlation |
| ACAP1 | 0.68 | 0.52 |
| C11orf83 | 0.67 | 0.62 |
| POLR2L | 0.66 | 0.68 |
| C9orf24 | 0.64 | 0.54 |
| PTRH1 | 0.63 | 0.50 |
| SSNA1 | 0.62 | 0.56 |
| PEX11G | 0.62 | 0.48 |
| IFI27L1 | 0.62 | 0.60 |
| DPM3 | 0.61 | 0.64 |
| POLR2I | 0.61 | 0.61 |
| Top 10 negatively co-expressed genes | ||
| Gene | Pearson's Correlation | Spearman's Correlation |
| AC016910.1 | -0.41 | -0.47 |
| NFAT5 | -0.37 | -0.44 |
| SLC20A1 | -0.37 | -0.42 |
| PLCL1 | -0.37 | -0.46 |
| DNM3 | -0.36 | -0.40 |
| NUAK1 | -0.36 | -0.39 |
| MYSM1 | -0.36 | -0.42 |
| KIAA0430 | -0.36 | -0.43 |
| USP31 | -0.36 | -0.39 |
| TTBK2 | -0.36 | -0.42 |
Section V. Pathway annotation
| Pathway name | Pathway size | # SZGR 2.0 genes in pathway | Info |
|---|---|---|---|
| PARENT MTOR SIGNALING UP | 567 | 375 | All SZGR 2.0 genes in this pathway |
| LIU CMYB TARGETS UP | 165 | 106 | All SZGR 2.0 genes in this pathway |
| OSMAN BLADDER CANCER UP | 404 | 246 | All SZGR 2.0 genes in this pathway |
| JAATINEN HEMATOPOIETIC STEM CELL DN | 226 | 132 | All SZGR 2.0 genes in this pathway |
| DODD NASOPHARYNGEAL CARCINOMA UP | 1821 | 933 | All SZGR 2.0 genes in this pathway |
| WANG ESOPHAGUS CANCER VS NORMAL DN | 101 | 66 | All SZGR 2.0 genes in this pathway |
| KRIGE RESPONSE TO TOSEDOSTAT 6HR UP | 953 | 554 | All SZGR 2.0 genes in this pathway |
| KRIGE RESPONSE TO TOSEDOSTAT 24HR UP | 783 | 442 | All SZGR 2.0 genes in this pathway |
| MARSON BOUND BY FOXP3 UNSTIMULATED | 1229 | 713 | All SZGR 2.0 genes in this pathway |
| HELLER SILENCED BY METHYLATION UP | 282 | 183 | All SZGR 2.0 genes in this pathway |
| HELLER HDAC TARGETS UP | 317 | 208 | All SZGR 2.0 genes in this pathway |
| HELLER HDAC TARGETS SILENCED BY METHYLATION UP | 461 | 298 | All SZGR 2.0 genes in this pathway |
| BONOME OVARIAN CANCER SURVIVAL SUBOPTIMAL DEBULKING | 510 | 309 | All SZGR 2.0 genes in this pathway |
| SHEDDEN LUNG CANCER GOOD SURVIVAL A4 | 196 | 124 | All SZGR 2.0 genes in this pathway |
| SHEDDEN LUNG CANCER GOOD SURVIVAL A12 | 317 | 177 | All SZGR 2.0 genes in this pathway |
| CROONQUIST NRAS VS STROMAL STIMULATION UP | 41 | 26 | All SZGR 2.0 genes in this pathway |
| HOSHIDA LIVER CANCER LATE RECURRENCE DN | 69 | 48 | All SZGR 2.0 genes in this pathway |
| HOSHIDA LIVER CANCER SURVIVAL DN | 113 | 76 | All SZGR 2.0 genes in this pathway |
| BROWNE HCMV INFECTION 30MIN UP | 56 | 38 | All SZGR 2.0 genes in this pathway |
| ZWANG TRANSIENTLY UP BY 1ST EGF PULSE ONLY | 1839 | 928 | All SZGR 2.0 genes in this pathway |