Gene Page: POMT1
Summary ?
| GeneID | 10585 |
| Symbol | POMT1 |
| Synonyms | LGMD2K|MDDGA1|MDDGB1|MDDGC1|RT |
| Description | protein O-mannosyltransferase 1 |
| Reference | MIM:607423|HGNC:HGNC:9202|Ensembl:ENSG00000130714|HPRD:06305|Vega:OTTHUMG00000020826 |
| Gene type | protein-coding |
| Map location | 9q34.1 |
| Pascal p-value | 0.715 |
| Sherlock p-value | 0.859 |
| TADA p-value | 0.015 |
| Fetal beta | 2.169 |
| eGene | Caudate basal ganglia Cerebellar Hemisphere Cerebellum Cortex |
| Support | CompositeSet |
Gene in Data Sources
| Gene set name | Method of gene set | Description | Info |
|---|---|---|---|
| CV:PGCnp | Genome-wide Association Study | GWAS | |
| DNM:Fromer_2014 | Whole Exome Sequencing analysis | This study reported a WES study of 623 schizophrenia trios, reporting DNMs using genomic DNA. |
Section I. Genetics and epigenetics annotation
 DNM table
| Gene | Chromosome | Position | Ref | Alt | Transcript | AA change | Mutation type | Sift | CG46 | Trait | Study |
|---|---|---|---|---|---|---|---|---|---|---|---|
| POMT1 | chr9 | 134388705 | C | T | NM_001077365 NM_001077366 NM_001136113 NM_001136114 NM_007171 | p.388R>C p.334R>C p.388R>C p.271R>C p.410R>C | missense missense missense missense missense | Schizophrenia | DNM:Fromer_2014 |
Section II. Transcriptome annotation
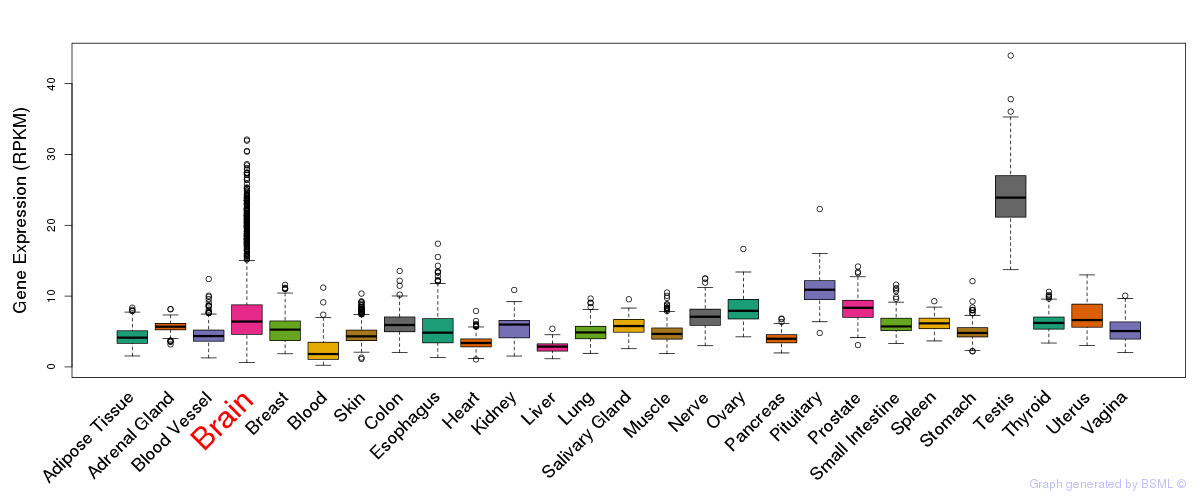
General gene expression (GTEx)
Gene expression during devlopment (BrainCloud)
Footnote:
A total of 269 time points ploted, with n=38 fetal samples (x=1:38). Each triangle represents one time point.
Gene expression of temporal and spatial changes (BrainSpan)
Footnote:
SC: sub-cortical regions; SM: sensory-motor regions; FC: frontal cortex; and TP: temporal-parietal cortex
ST1: fetal (13 - 26 postconception weeks), ST2: early infancy to late childhood (4 months to 11 years), and ST3: adolescence to adulthood (13 - 23 years)
The bar shown representes the lower 25% and upper 25% of the expression distribution.
Top co-expressed genes in brain regions
| Top 10 positively co-expressed genes | ||
| Gene | Pearson's Correlation | Spearman's Correlation |
| BAT2 | 0.93 | 0.96 |
| SRCAP | 0.93 | 0.95 |
| SETD1A | 0.92 | 0.96 |
| PCNXL3 | 0.92 | 0.94 |
| MNT | 0.92 | 0.95 |
| TCOF1 | 0.92 | 0.94 |
| LPHN1 | 0.91 | 0.93 |
| LHFPL4 | 0.91 | 0.93 |
| BRUNOL5 | 0.91 | 0.91 |
| ZNF512B | 0.91 | 0.93 |
| Top 10 negatively co-expressed genes | ||
| Gene | Pearson's Correlation | Spearman's Correlation |
| AF347015.31 | -0.72 | -0.80 |
| MT-CO2 | -0.70 | -0.79 |
| AF347015.21 | -0.68 | -0.85 |
| AF347015.27 | -0.68 | -0.76 |
| MT-CYB | -0.67 | -0.75 |
| HIGD1B | -0.67 | -0.77 |
| COPZ2 | -0.67 | -0.73 |
| AF347015.33 | -0.67 | -0.72 |
| S100B | -0.66 | -0.74 |
| AF347015.8 | -0.66 | -0.76 |
Section V. Pathway annotation
| Pathway name | Pathway size | # SZGR 2.0 genes in pathway | Info |
|---|---|---|---|
| CHANDRAN METASTASIS TOP50 DN | 45 | 26 | All SZGR 2.0 genes in this pathway |
| CHARAFE BREAST CANCER LUMINAL VS BASAL UP | 380 | 215 | All SZGR 2.0 genes in this pathway |
| LINDVALL IMMORTALIZED BY TERT UP | 78 | 48 | All SZGR 2.0 genes in this pathway |
| XU GH1 AUTOCRINE TARGETS DN | 142 | 94 | All SZGR 2.0 genes in this pathway |
| CREIGHTON ENDOCRINE THERAPY RESISTANCE 2 | 473 | 224 | All SZGR 2.0 genes in this pathway |
| SANSOM APC TARGETS REQUIRE MYC | 210 | 123 | All SZGR 2.0 genes in this pathway |
| BREDEMEYER RAG SIGNALING VIA ATM NOT VIA NFKB DN | 38 | 23 | All SZGR 2.0 genes in this pathway |
| BOYLAN MULTIPLE MYELOMA C CLUSTER UP | 38 | 26 | All SZGR 2.0 genes in this pathway |
| CHANDRAN METASTASIS DN | 306 | 191 | All SZGR 2.0 genes in this pathway |
| LIM MAMMARY STEM CELL DN | 428 | 246 | All SZGR 2.0 genes in this pathway |
| ZWANG TRANSIENTLY UP BY 1ST EGF PULSE ONLY | 1839 | 928 | All SZGR 2.0 genes in this pathway |