Gene Page: RAI1
Summary ?
| GeneID | 10743 |
| Symbol | RAI1 |
| Synonyms | SMCR|SMS |
| Description | retinoic acid induced 1 |
| Reference | MIM:607642|HGNC:HGNC:9834|Ensembl:ENSG00000108557|HPRD:07406|Vega:OTTHUMG00000059314 |
| Gene type | protein-coding |
| Map location | 17p11.2 |
| Pascal p-value | 1.803E-5 |
| Sherlock p-value | 0.747 |
| Fetal beta | 0.94 |
| DMG | 1 (# studies) |
Gene in Data Sources
| Gene set name | Method of gene set | Description | Info |
|---|---|---|---|
| CV:PGCnp | Genome-wide Association Study | GWAS | |
| DMG:Wockner_2014 | Genome-wide DNA methylation analysis | This dataset includes 4641 differentially methylated probes corresponding to 2929 unique genes between schizophrenia patients (n=24) and controls (n=24). | 1 |
| PMID:cooccur | High-throughput literature-search | Systematic search in PubMed for genes co-occurring with SCZ keywords. A total of 3027 genes were included. | |
| Literature | High-throughput literature-search | Co-occurance with Schizophrenia keywords: schizophrenia,schizophrenic,schizophrenias | Click to show details |
Section I. Genetics and epigenetics annotation
 Differentially methylated gene
| Probe | Chromosome | Position | Nearest gene | P (dis) | Beta (dis) | FDR (dis) | Study |
|---|---|---|---|---|---|---|---|
| cg19447962 | 17 | 17628656 | RAI1 | 4.094E-4 | 0.758 | 0.044 | DMG:Wockner_2014 |
Section II. Transcriptome annotation
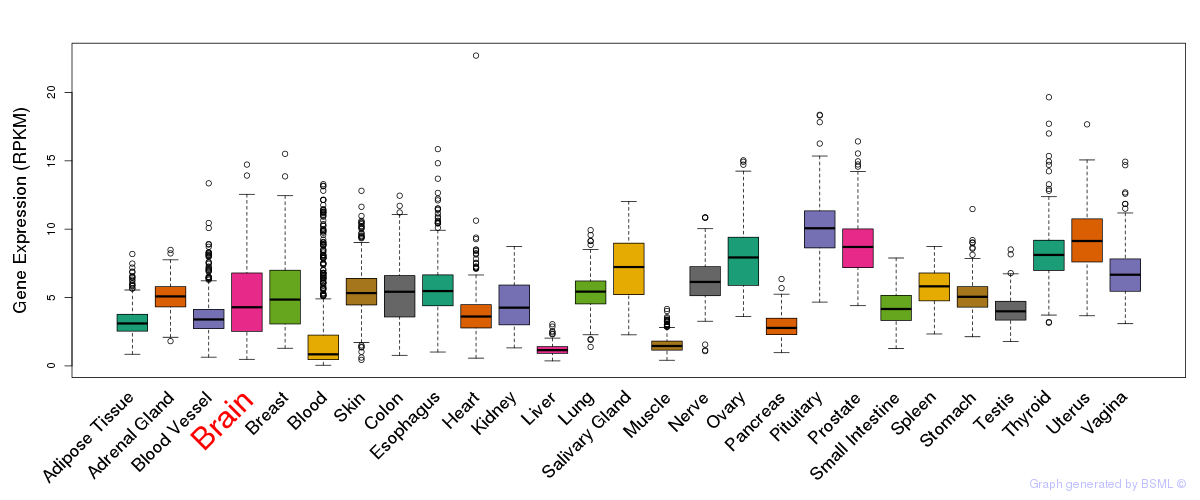
General gene expression (GTEx)
Gene expression during devlopment (BrainCloud)
Footnote:
A total of 269 time points ploted, with n=38 fetal samples (x=1:38). Each triangle represents one time point.
Gene expression of temporal and spatial changes (BrainSpan)
Footnote:
SC: sub-cortical regions; SM: sensory-motor regions; FC: frontal cortex; and TP: temporal-parietal cortex
ST1: fetal (13 - 26 postconception weeks), ST2: early infancy to late childhood (4 months to 11 years), and ST3: adolescence to adulthood (13 - 23 years)
The bar shown representes the lower 25% and upper 25% of the expression distribution.
Top co-expressed genes in brain regions
| Top 10 positively co-expressed genes | ||
| Gene | Pearson's Correlation | Spearman's Correlation |
| NLRX1 | 0.64 | 0.66 |
| TTYH1 | 0.63 | 0.66 |
| LAMB2 | 0.62 | 0.66 |
| CTDSP1 | 0.62 | 0.67 |
| ANKRD35 | 0.62 | 0.67 |
| SLC12A4 | 0.61 | 0.69 |
| MFGE8 | 0.60 | 0.62 |
| ARSE | 0.60 | 0.62 |
| ITGB5 | 0.60 | 0.67 |
| TRIM47 | 0.60 | 0.61 |
| Top 10 negatively co-expressed genes | ||
| Gene | Pearson's Correlation | Spearman's Correlation |
| KLHL1 | -0.53 | -0.48 |
| GPR22 | -0.52 | -0.54 |
| DPP4 | -0.52 | -0.53 |
| ANKRD12 | -0.51 | -0.53 |
| DACT1 | -0.50 | -0.40 |
| NELL2 | -0.50 | -0.45 |
| FAM49A | -0.50 | -0.46 |
| SATB2 | -0.50 | -0.49 |
| TBC1D30 | -0.49 | -0.42 |
| ATXN7L1 | -0.49 | -0.41 |
Section III. Gene Ontology annotation
| Molecular function | GO term | Evidence | Neuro keywords | PubMed ID |
|---|---|---|---|---|
| GO:0005515 | protein binding | IEA | - | |
| GO:0008270 | zinc ion binding | IEA | - | |
| GO:0046872 | metal ion binding | IEA | - | |
| Cellular component | GO term | Evidence | Neuro keywords | PubMed ID |
| GO:0005634 | nucleus | IEA | - | |
| GO:0005737 | cytoplasm | IEA | - |
Section V. Pathway annotation
| Pathway name | Pathway size | # SZGR 2.0 genes in pathway | Info |
|---|---|---|---|
| GOZGIT ESR1 TARGETS DN | 781 | 465 | All SZGR 2.0 genes in this pathway |
| ODONNELL METASTASIS UP | 82 | 58 | All SZGR 2.0 genes in this pathway |
| BENPORATH NANOG TARGETS | 988 | 594 | All SZGR 2.0 genes in this pathway |
| MORI EMU MYC LYMPHOMA BY ONSET TIME UP | 110 | 69 | All SZGR 2.0 genes in this pathway |
| LEE RECENT THYMIC EMIGRANT | 227 | 128 | All SZGR 2.0 genes in this pathway |
| MILI PSEUDOPODIA HAPTOTAXIS DN | 668 | 419 | All SZGR 2.0 genes in this pathway |
| MEISSNER NPC HCP WITH H3K4ME2 | 491 | 319 | All SZGR 2.0 genes in this pathway |
| WONG ADULT TISSUE STEM MODULE | 721 | 492 | All SZGR 2.0 genes in this pathway |
| DELACROIX RAR BOUND ES | 462 | 273 | All SZGR 2.0 genes in this pathway |
Section VI. microRNA annotation
| miRNA family | Target position | miRNA ID | miRNA seq | ||
|---|---|---|---|---|---|
| UTR start | UTR end | Match method | |||
| miR-181 | 946 | 952 | 1A | hsa-miR-181abrain | AACAUUCAACGCUGUCGGUGAGU |
| hsa-miR-181bSZ | AACAUUCAUUGCUGUCGGUGGG | ||||
| hsa-miR-181cbrain | AACAUUCAACCUGUCGGUGAGU | ||||
| hsa-miR-181dbrain | AACAUUCAUUGUUGUCGGUGGGUU | ||||
| miR-194 | 937 | 943 | 1A | hsa-miR-194 | UGUAACAGCAACUCCAUGUGGA |
| miR-329 | 1223 | 1229 | 1A | hsa-miR-329brain | AACACACCUGGUUAACCUCUUU |
| hsa-miR-329brain | AACACACCUGGUUAACCUCUUU | ||||
| miR-369-3p | 1227 | 1234 | 1A,m8 | hsa-miR-369-3p | AAUAAUACAUGGUUGAUCUUU |
| miR-374 | 1228 | 1234 | m8 | hsa-miR-374 | UUAUAAUACAACCUGAUAAGUG |
| miR-410 | 1244 | 1251 | 1A,m8 | hsa-miR-410 | AAUAUAACACAGAUGGCCUGU |
| miR-488 | 1233 | 1239 | m8 | hsa-miR-488 | CCCAGAUAAUGGCACUCUCAA |
| miR-493-5p | 906 | 912 | 1A | hsa-miR-493-5p | UUGUACAUGGUAGGCUUUCAUU |
| miR-543 | 1303 | 1309 | 1A | hsa-miR-543 | AAACAUUCGCGGUGCACUUCU |
- SZ: miRNAs which differentially expressed in brain cortex of schizophrenia patients comparing with control samples using microarray. Click here to see the list of SZ related miRNAs.
- Brain: miRNAs which are expressed in brain based on miRNA microarray expression studies. Click here to see the list of brain related miRNAs.