Gene Page: LDHD
Summary ?
| GeneID | 197257 |
| Symbol | LDHD |
| Synonyms | DLD |
| Description | lactate dehydrogenase D |
| Reference | MIM:607490|HGNC:HGNC:19708|Ensembl:ENSG00000166816|HPRD:06318|Vega:OTTHUMG00000137605 |
| Gene type | protein-coding |
| Map location | 16q23.1 |
| Pascal p-value | 0.35 |
| Sherlock p-value | 0.438 |
| DEG p-value | DEG:Zhao_2015:p=6.26e-04:q=0.0940 |
| Fetal beta | -1.462 |
| DMG | 1 (# studies) |
| eGene | Myers' cis & trans |
Gene in Data Sources
| Gene set name | Method of gene set | Description | Info |
|---|---|---|---|
| CV:PGCnp | Genome-wide Association Study | GWAS | |
| DEG:Zhao_2015 | RNA Sequencing analysis | Transcriptome sequencing and genome-wide association analyses reveal lysosomal function and actin cytoskeleton remodeling in schizophrenia and bipolar disorder. | |
| DMG:Wockner_2014 | Genome-wide DNA methylation analysis | This dataset includes 4641 differentially methylated probes corresponding to 2929 unique genes between schizophrenia patients (n=24) and controls (n=24). | 1 |
Section I. Genetics and epigenetics annotation
 Differentially methylated gene
| Probe | Chromosome | Position | Nearest gene | P (dis) | Beta (dis) | FDR (dis) | Study |
|---|---|---|---|---|---|---|---|
| cg04906242 | 16 | 75150880 | LDHD | 2.36E-5 | 0.348 | 0.017 | DMG:Wockner_2014 |
eQTL annotation
| SNP ID | Chromosome | Position | eGene | Gene Entrez ID | pvalue | qvalue | TSS distance | eQTL type |
|---|---|---|---|---|---|---|---|---|
| rs7975356 | chr12 | 29630080 | LDHD | 197257 | 0.08 | trans |
Section II. Transcriptome annotation
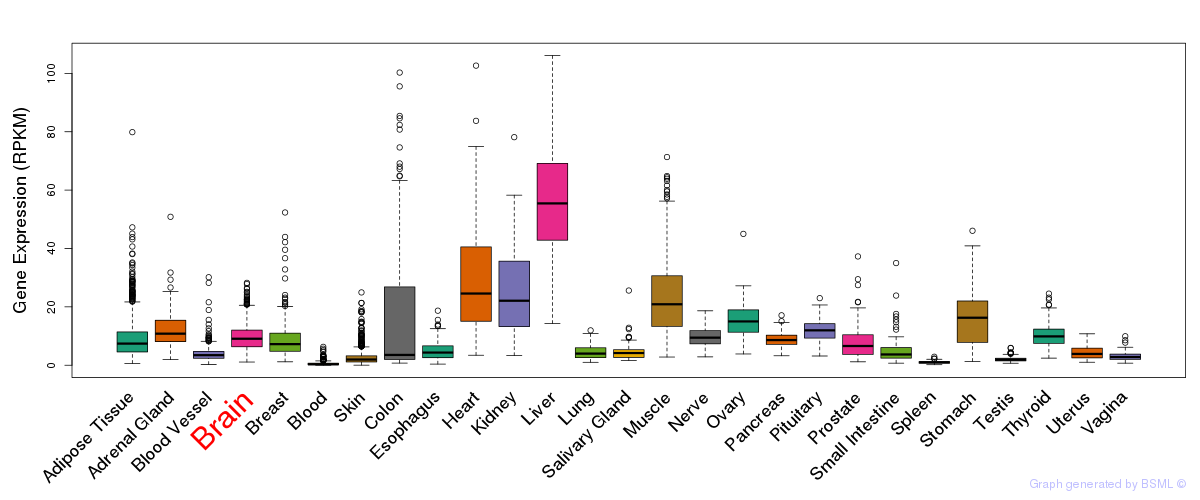
General gene expression (GTEx)
Gene expression during devlopment (BrainCloud)
Footnote:
A total of 269 time points ploted, with n=38 fetal samples (x=1:38). Each triangle represents one time point.
Gene expression of temporal and spatial changes (BrainSpan)
Footnote:
SC: sub-cortical regions; SM: sensory-motor regions; FC: frontal cortex; and TP: temporal-parietal cortex
ST1: fetal (13 - 26 postconception weeks), ST2: early infancy to late childhood (4 months to 11 years), and ST3: adolescence to adulthood (13 - 23 years)
The bar shown representes the lower 25% and upper 25% of the expression distribution.
No co-expressed genes in brain regions
Section V. Pathway annotation
| Pathway name | Pathway size | # SZGR 2.0 genes in pathway | Info |
|---|---|---|---|
| KEGG PYRUVATE METABOLISM | 40 | 26 | All SZGR 2.0 genes in this pathway |
| REACTOME MITOCHONDRIAL PROTEIN IMPORT | 58 | 24 | All SZGR 2.0 genes in this pathway |
| REACTOME METABOLISM OF PROTEINS | 518 | 242 | All SZGR 2.0 genes in this pathway |
| IVANOVA HEMATOPOIESIS STEM CELL AND PROGENITOR | 681 | 420 | All SZGR 2.0 genes in this pathway |
| GAVIN FOXP3 TARGETS CLUSTER P2 | 79 | 55 | All SZGR 2.0 genes in this pathway |
| KYNG DNA DAMAGE BY GAMMA AND UV RADIATION | 88 | 65 | All SZGR 2.0 genes in this pathway |
| KYNG DNA DAMAGE UP | 226 | 164 | All SZGR 2.0 genes in this pathway |
| LEE LIVER CANCER | 49 | 29 | All SZGR 2.0 genes in this pathway |
| IWANAGA CARCINOGENESIS BY KRAS PTEN UP | 181 | 112 | All SZGR 2.0 genes in this pathway |
| IWANAGA CARCINOGENESIS BY KRAS UP | 170 | 107 | All SZGR 2.0 genes in this pathway |
| CHIANG LIVER CANCER SUBCLASS PROLIFERATION DN | 179 | 97 | All SZGR 2.0 genes in this pathway |
| MIKKELSEN ES ICP WITH H3K4ME3 | 718 | 401 | All SZGR 2.0 genes in this pathway |
| YANG BCL3 TARGETS UP | 364 | 236 | All SZGR 2.0 genes in this pathway |