Gene Page: FAAH
Summary ?
| GeneID | 2166 |
| Symbol | FAAH |
| Synonyms | FAAH-1|PSAB |
| Description | fatty acid amide hydrolase |
| Reference | MIM:602935|HGNC:HGNC:3553|Ensembl:ENSG00000117480|HPRD:04244|Vega:OTTHUMG00000007811 |
| Gene type | protein-coding |
| Map location | 1p35-p34 |
| Pascal p-value | 0.97 |
| Sherlock p-value | 0.79 |
| Fetal beta | -1.097 |
| eGene | Cerebellum |
Gene in Data Sources
| Gene set name | Method of gene set | Description | Info |
|---|---|---|---|
| CV:PGCnp | Genome-wide Association Study | GWAS | |
| PMID:cooccur | High-throughput literature-search | Systematic search in PubMed for genes co-occurring with SCZ keywords. A total of 3027 genes were included. | |
| Literature | High-throughput literature-search | Co-occurance with Schizophrenia keywords: schizophrenia,schizophrenic,schizophrenias | Click to show details |
| GO_Annotation | Mapping neuro-related keywords to Gene Ontology annotations | Hits with neuro-related keywords: 1 |
Section I. Genetics and epigenetics annotation
Section II. Transcriptome annotation
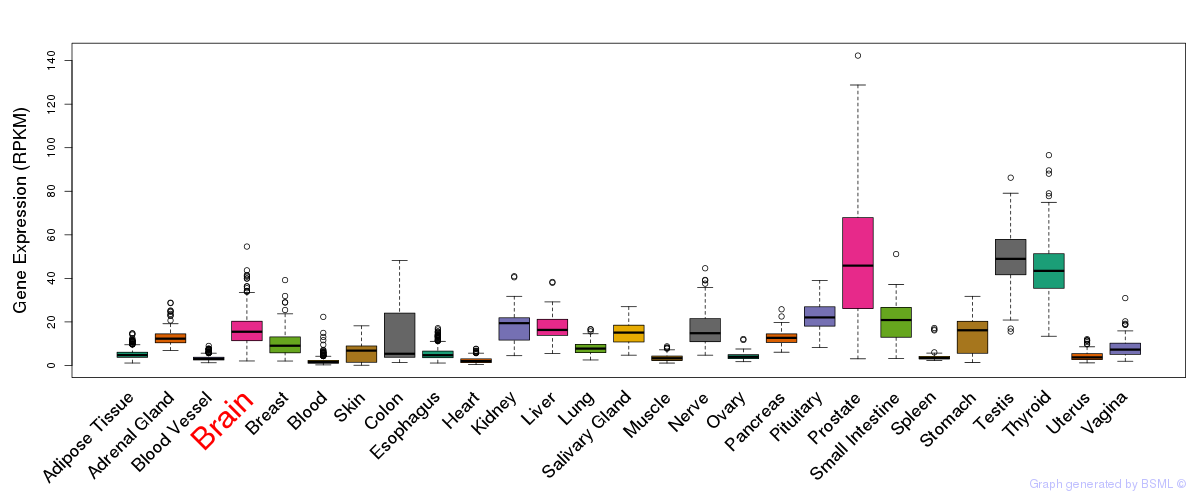
General gene expression (GTEx)
Gene expression during devlopment (BrainCloud)
Footnote:
A total of 269 time points ploted, with n=38 fetal samples (x=1:38). Each triangle represents one time point.
Gene expression of temporal and spatial changes (BrainSpan)
Footnote:
SC: sub-cortical regions; SM: sensory-motor regions; FC: frontal cortex; and TP: temporal-parietal cortex
ST1: fetal (13 - 26 postconception weeks), ST2: early infancy to late childhood (4 months to 11 years), and ST3: adolescence to adulthood (13 - 23 years)
The bar shown representes the lower 25% and upper 25% of the expression distribution.
Top co-expressed genes in brain regions
| Top 10 positively co-expressed genes | ||
| Gene | Pearson's Correlation | Spearman's Correlation |
| PTPLAD1 | 0.86 | 0.86 |
| UBE3C | 0.86 | 0.87 |
| PRKAR1A | 0.86 | 0.91 |
| CLTC | 0.85 | 0.90 |
| BBS7 | 0.85 | 0.87 |
| MTMR7 | 0.85 | 0.84 |
| FAM169A | 0.84 | 0.88 |
| USP14 | 0.84 | 0.89 |
| LIG4 | 0.84 | 0.86 |
| DCUN1D4 | 0.84 | 0.82 |
| Top 10 negatively co-expressed genes | ||
| Gene | Pearson's Correlation | Spearman's Correlation |
| C1orf61 | -0.53 | -0.64 |
| AF347015.21 | -0.51 | -0.44 |
| EIF4EBP3 | -0.51 | -0.57 |
| HIGD1B | -0.48 | -0.46 |
| C16orf74 | -0.47 | -0.52 |
| FXYD1 | -0.47 | -0.43 |
| AF347015.31 | -0.47 | -0.46 |
| AP002478.3 | -0.46 | -0.48 |
| MT-CO2 | -0.46 | -0.46 |
| CSAG1 | -0.46 | -0.44 |
Section III. Gene Ontology annotation
| Molecular function | GO term | Evidence | Neuro keywords | PubMed ID |
|---|---|---|---|---|
| GO:0016884 | carbon-nitrogen ligase activity, with glutamine as amido-N-donor | IEA | glutamate (GO term level: 5) | - |
| GO:0004040 | amidase activity | TAS | 10431820 | |
| GO:0016787 | hydrolase activity | IEA | - | |
| Biological process | GO term | Evidence | Neuro keywords | PubMed ID |
| GO:0006631 | fatty acid metabolic process | TAS | 9122178 | |
| Cellular component | GO term | Evidence | Neuro keywords | PubMed ID |
| GO:0012505 | endomembrane system | IEA | - | |
| GO:0005856 | cytoskeleton | IEA | - | |
| GO:0005624 | membrane fraction | TAS | 9122178 | |
| GO:0005737 | cytoplasm | IEA | - | |
| GO:0016020 | membrane | IEA | - | |
| GO:0016021 | integral to membrane | IEA | - |
Section V. Pathway annotation
| Pathway name | Pathway size | # SZGR 2.0 genes in pathway | Info |
|---|---|---|---|
| KIM RESPONSE TO TSA AND DECITABINE UP | 129 | 73 | All SZGR 2.0 genes in this pathway |
| CHEMNITZ RESPONSE TO PROSTAGLANDIN E2 DN | 391 | 222 | All SZGR 2.0 genes in this pathway |
| DIAZ CHRONIC MEYLOGENOUS LEUKEMIA DN | 116 | 79 | All SZGR 2.0 genes in this pathway |
| CHARAFE BREAST CANCER LUMINAL VS MESENCHYMAL UP | 450 | 256 | All SZGR 2.0 genes in this pathway |
| DELYS THYROID CANCER DN | 232 | 154 | All SZGR 2.0 genes in this pathway |
| GRAESSMANN APOPTOSIS BY DOXORUBICIN DN | 1781 | 1082 | All SZGR 2.0 genes in this pathway |
| GRAESSMANN RESPONSE TO MC AND DOXORUBICIN DN | 770 | 415 | All SZGR 2.0 genes in this pathway |
| LE EGR2 TARGETS DN | 108 | 84 | All SZGR 2.0 genes in this pathway |
| SHIPP DLBCL CURED VS FATAL UP | 39 | 22 | All SZGR 2.0 genes in this pathway |
| ALCALAY AML BY NPM1 LOCALIZATION DN | 184 | 132 | All SZGR 2.0 genes in this pathway |
| IVANOVA HEMATOPOIESIS STEM CELL LONG TERM | 302 | 191 | All SZGR 2.0 genes in this pathway |
| ACEVEDO LIVER CANCER DN | 540 | 340 | All SZGR 2.0 genes in this pathway |
| ACEVEDO LIVER TUMOR VS NORMAL ADJACENT TISSUE DN | 274 | 165 | All SZGR 2.0 genes in this pathway |
| SMID BREAST CANCER BASAL DN | 701 | 446 | All SZGR 2.0 genes in this pathway |
| BOCHKIS FOXA2 TARGETS | 425 | 261 | All SZGR 2.0 genes in this pathway |
| WEST ADRENOCORTICAL TUMOR DN | 546 | 362 | All SZGR 2.0 genes in this pathway |
| YOSHIMURA MAPK8 TARGETS UP | 1305 | 895 | All SZGR 2.0 genes in this pathway |
| VANTVEER BREAST CANCER ESR1 UP | 167 | 99 | All SZGR 2.0 genes in this pathway |
| GYORFFY DOXORUBICIN RESISTANCE | 56 | 34 | All SZGR 2.0 genes in this pathway |
| CAIRO HEPATOBLASTOMA DN | 267 | 160 | All SZGR 2.0 genes in this pathway |
| OHGUCHI LIVER HNF4A TARGETS DN | 149 | 85 | All SZGR 2.0 genes in this pathway |
| FEVR CTNNB1 TARGETS UP | 682 | 433 | All SZGR 2.0 genes in this pathway |
| TORCHIA TARGETS OF EWSR1 FLI1 FUSION UP | 271 | 165 | All SZGR 2.0 genes in this pathway |
| LIM MAMMARY STEM CELL DN | 428 | 246 | All SZGR 2.0 genes in this pathway |
| LIM MAMMARY LUMINAL MATURE UP | 116 | 65 | All SZGR 2.0 genes in this pathway |