Gene Page: NSUN6
Summary ?
| GeneID | 221078 |
| Symbol | NSUN6 |
| Synonyms | 4933414E04Rik|ARL5B-AS1|NOPD1 |
| Description | NOP2/Sun RNA methyltransferase family member 6 |
| Reference | HGNC:HGNC:23529|Ensembl:ENSG00000241058|HPRD:14843|Vega:OTTHUMG00000017767 |
| Gene type | protein-coding |
| Map location | 10p12.31 |
| Pascal p-value | 2.238E-4 |
| Sherlock p-value | 0.837 |
| Fetal beta | 0.155 |
| DMG | 1 (# studies) |
| eGene | Caudate basal ganglia Cerebellar Hemisphere Cerebellum Cortex Frontal Cortex BA9 Putamen basal ganglia Myers' cis & trans Meta |
Gene in Data Sources
| Gene set name | Method of gene set | Description | Info |
|---|---|---|---|
| CV:PGCnp | Genome-wide Association Study | GWAS | |
| DMG:Jaffe_2016 | Genome-wide DNA methylation analysis | This dataset includes 2,104 probes/CpGs associated with SZ patients (n=108) compared to 136 controls at Bonferroni-adjusted P < 0.05. | 1 |
| LK:YES | Genome-wide Association Study | This data set included 99 genes mapped to the 22 regions. The 24 leading SNPs were also included in CV:Ripke_2013 |
Section I. Genetics and epigenetics annotation
 Differentially methylated gene
| Probe | Chromosome | Position | Nearest gene | P (dis) | Beta (dis) | FDR (dis) | Study |
|---|---|---|---|---|---|---|---|
| cg26536847 | 10 | 18940347 | NSUN6 | 7.66E-9 | -0.021 | 3.74E-6 | DMG:Jaffe_2016 |
eQTL annotation
| SNP ID | Chromosome | Position | eGene | Gene Entrez ID | pvalue | qvalue | TSS distance | eQTL type |
|---|---|---|---|---|---|---|---|---|
| rs7367244 | 0 | NSUN6 | 221078 | 0.19 | trans | |||
| rs12257556 | 10 | 18790503 | NSUN6 | ENSG00000241058.1 | 2.286E-6 | 0.01 | 114719 | gtex_brain_putamen_basal |
| rs4748474 | 10 | 18790727 | NSUN6 | ENSG00000241058.1 | 2.286E-6 | 0.01 | 114495 | gtex_brain_putamen_basal |
| rs4748475 | 10 | 18790980 | NSUN6 | ENSG00000241058.1 | 1.337E-6 | 0.01 | 114242 | gtex_brain_putamen_basal |
| rs12776325 | 10 | 18791529 | NSUN6 | ENSG00000241058.1 | 1.16E-6 | 0.01 | 113693 | gtex_brain_putamen_basal |
| rs4634984 | 10 | 18868840 | NSUN6 | ENSG00000241058.1 | 5.468E-7 | 0.01 | 36382 | gtex_brain_putamen_basal |
| rs2691159 | 10 | 18914096 | NSUN6 | ENSG00000241058.1 | 1.708E-6 | 0.01 | -8874 | gtex_brain_putamen_basal |
| rs7921366 | 10 | 18914175 | NSUN6 | ENSG00000241058.1 | 1.708E-6 | 0.01 | -8953 | gtex_brain_putamen_basal |
| rs10829038 | 10 | 18914931 | NSUN6 | ENSG00000241058.1 | 1.708E-6 | 0.01 | -9709 | gtex_brain_putamen_basal |
| rs7077692 | 10 | 18922472 | NSUN6 | ENSG00000241058.1 | 1.701E-6 | 0.01 | -17250 | gtex_brain_putamen_basal |
| rs7098313 | 10 | 18922557 | NSUN6 | ENSG00000241058.1 | 1.708E-6 | 0.01 | -17335 | gtex_brain_putamen_basal |
| rs7084525 | 10 | 18922567 | NSUN6 | ENSG00000241058.1 | 1.706E-6 | 0.01 | -17345 | gtex_brain_putamen_basal |
| rs11015263 | 10 | 18925775 | NSUN6 | ENSG00000241058.1 | 1.704E-6 | 0.01 | -20553 | gtex_brain_putamen_basal |
| rs7101352 | 10 | 18927937 | NSUN6 | ENSG00000241058.1 | 2.118E-6 | 0.01 | -22715 | gtex_brain_putamen_basal |
| rs7077637 | 10 | 18928274 | NSUN6 | ENSG00000241058.1 | 1.708E-6 | 0.01 | -23052 | gtex_brain_putamen_basal |
| rs1352655 | 10 | 18929681 | NSUN6 | ENSG00000241058.1 | 1.708E-6 | 0.01 | -24459 | gtex_brain_putamen_basal |
| rs7907153 | 10 | 18931512 | NSUN6 | ENSG00000241058.1 | 1.708E-6 | 0.01 | -26290 | gtex_brain_putamen_basal |
| rs1880682 | 10 | 18932172 | NSUN6 | ENSG00000241058.1 | 1.692E-6 | 0.01 | -26950 | gtex_brain_putamen_basal |
| rs11015306 | 10 | 18932702 | NSUN6 | ENSG00000241058.1 | 1.708E-6 | 0.01 | -27480 | gtex_brain_putamen_basal |
| rs11015307 | 10 | 18932743 | NSUN6 | ENSG00000241058.1 | 1.708E-6 | 0.01 | -27521 | gtex_brain_putamen_basal |
| rs7071897 | 10 | 18933802 | NSUN6 | ENSG00000241058.1 | 1.708E-6 | 0.01 | -28580 | gtex_brain_putamen_basal |
| rs60303763 | 10 | 18934194 | NSUN6 | ENSG00000241058.1 | 1.804E-6 | 0.01 | -28972 | gtex_brain_putamen_basal |
| rs1968961 | 10 | 18935528 | NSUN6 | ENSG00000241058.1 | 1.821E-6 | 0.01 | -30306 | gtex_brain_putamen_basal |
| rs4748503 | 10 | 18936079 | NSUN6 | ENSG00000241058.1 | 1.708E-6 | 0.01 | -30857 | gtex_brain_putamen_basal |
| rs7070695 | 10 | 18938943 | NSUN6 | ENSG00000241058.1 | 1.708E-6 | 0.01 | -33721 | gtex_brain_putamen_basal |
| rs7095070 | 10 | 18939070 | NSUN6 | ENSG00000241058.1 | 1.708E-6 | 0.01 | -33848 | gtex_brain_putamen_basal |
| rs10829133 | 10 | 18941670 | NSUN6 | ENSG00000241058.1 | 1.695E-6 | 0.01 | -36448 | gtex_brain_putamen_basal |
| rs66507840 | 10 | 18944699 | NSUN6 | ENSG00000241058.1 | 1.681E-6 | 0.01 | -39477 | gtex_brain_putamen_basal |
| rs10829139 | 10 | 18944975 | NSUN6 | ENSG00000241058.1 | 1.678E-6 | 0.01 | -39753 | gtex_brain_putamen_basal |
| rs12412484 | 10 | 18945380 | NSUN6 | ENSG00000241058.1 | 1.651E-6 | 0.01 | -40158 | gtex_brain_putamen_basal |
| rs11015411 | 10 | 18945939 | NSUN6 | ENSG00000241058.1 | 1.672E-6 | 0.01 | -40717 | gtex_brain_putamen_basal |
| rs4748508 | 10 | 18958646 | NSUN6 | ENSG00000241058.1 | 1.667E-6 | 0.01 | -53424 | gtex_brain_putamen_basal |
| rs7086911 | 10 | 18960080 | NSUN6 | ENSG00000241058.1 | 9.756E-7 | 0.01 | -54858 | gtex_brain_putamen_basal |
Section II. Transcriptome annotation
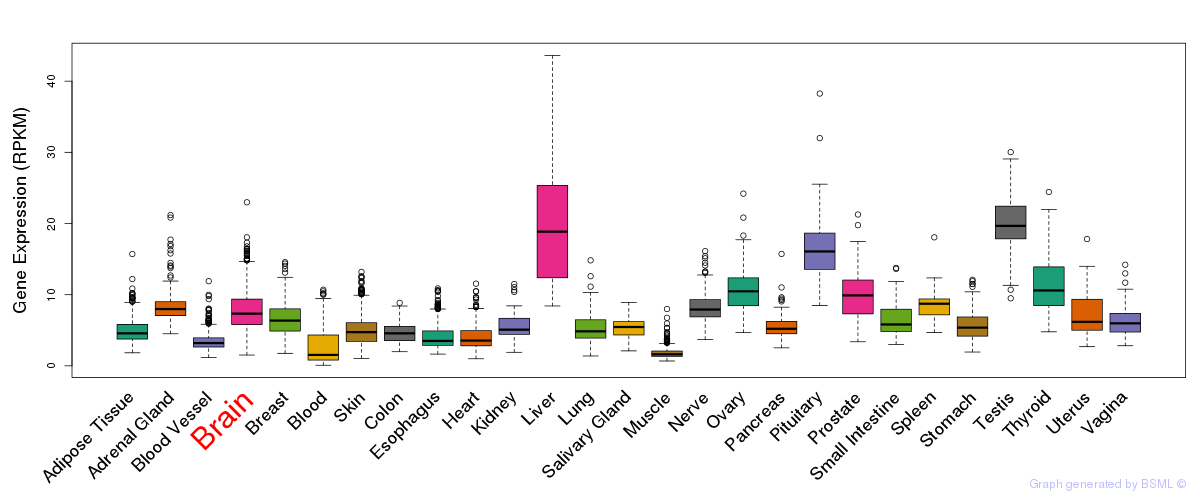
General gene expression (GTEx)
Gene expression during devlopment (BrainCloud)
Footnote:
A total of 269 time points ploted, with n=38 fetal samples (x=1:38). Each triangle represents one time point.
Gene expression of temporal and spatial changes (BrainSpan)
Footnote:
SC: sub-cortical regions; SM: sensory-motor regions; FC: frontal cortex; and TP: temporal-parietal cortex
ST1: fetal (13 - 26 postconception weeks), ST2: early infancy to late childhood (4 months to 11 years), and ST3: adolescence to adulthood (13 - 23 years)
The bar shown representes the lower 25% and upper 25% of the expression distribution.
No co-expressed genes in brain regions
Section V. Pathway annotation
| Pathway name | Pathway size | # SZGR 2.0 genes in pathway | Info |
|---|---|---|---|
| MARSON BOUND BY FOXP3 STIMULATED | 1022 | 619 | All SZGR 2.0 genes in this pathway |
| CHEN HOXA5 TARGETS 9HR UP | 223 | 132 | All SZGR 2.0 genes in this pathway |
| CHIANG LIVER CANCER SUBCLASS UNANNOTATED UP | 85 | 50 | All SZGR 2.0 genes in this pathway |
| CAIRO HEPATOBLASTOMA DN | 267 | 160 | All SZGR 2.0 genes in this pathway |
| MIKKELSEN ES ICP WITH H3K4ME3 | 718 | 401 | All SZGR 2.0 genes in this pathway |
| MIKKELSEN NPC ICP WITH H3K4ME3 | 445 | 257 | All SZGR 2.0 genes in this pathway |
| TERAO AOX4 TARGETS SKIN UP | 38 | 27 | All SZGR 2.0 genes in this pathway |