Gene Page: SLC4A1AP
Summary ?
| GeneID | 22950 |
| Symbol | SLC4A1AP |
| Synonyms | HLC3 |
| Description | solute carrier family 4 member 1 adaptor protein |
| Reference | MIM:602655|HGNC:HGNC:13813|Ensembl:ENSG00000163798|HPRD:04038|Vega:OTTHUMG00000151944 |
| Gene type | protein-coding |
| Map location | 2p23.3 |
| Pascal p-value | 2.888E-4 |
| Sherlock p-value | 0.489 |
| Fetal beta | -0.88 |
| DMG | 1 (# studies) |
| eGene | Myers' cis & trans |
| Support | Ascano FMRP targets |
Gene in Data Sources
| Gene set name | Method of gene set | Description | Info |
|---|---|---|---|
| CV:PGCnp | Genome-wide Association Study | GWAS | |
| DMG:Jaffe_2016 | Genome-wide DNA methylation analysis | This dataset includes 2,104 probes/CpGs associated with SZ patients (n=108) compared to 136 controls at Bonferroni-adjusted P < 0.05. | 1 |
Section I. Genetics and epigenetics annotation
 Differentially methylated gene
| Probe | Chromosome | Position | Nearest gene | P (dis) | Beta (dis) | FDR (dis) | Study |
|---|---|---|---|---|---|---|---|
| cg09131135 | 2 | 27886635 | SLC4A1AP | 1.92E-8 | -0.012 | 6.75E-6 | DMG:Jaffe_2016 |
eQTL annotation
| SNP ID | Chromosome | Position | eGene | Gene Entrez ID | pvalue | qvalue | TSS distance | eQTL type |
|---|---|---|---|---|---|---|---|---|
| rs10994209 | chr10 | 61877705 | SLC4A1AP | 22950 | 0.04 | trans |
Section II. Transcriptome annotation
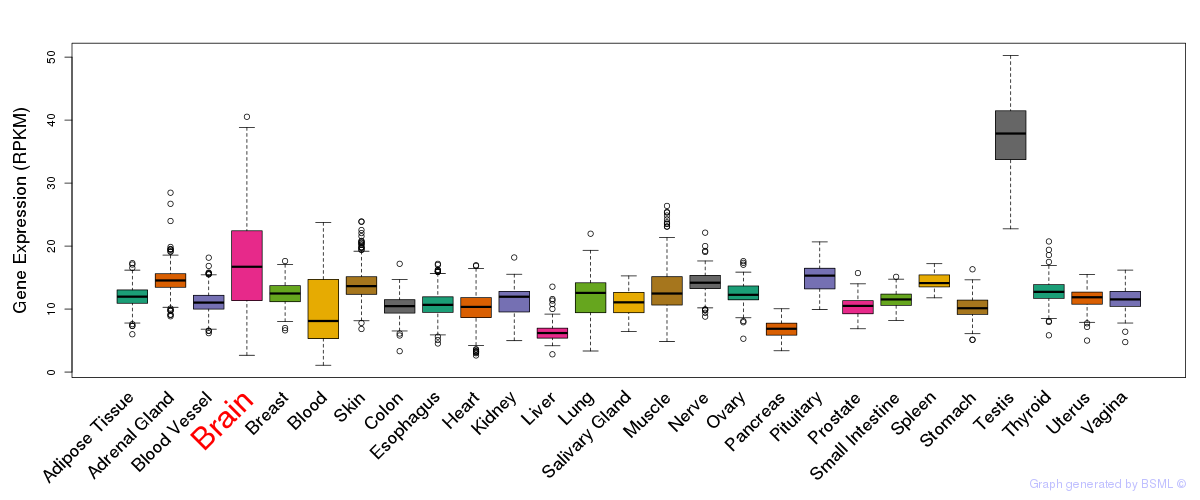
General gene expression (GTEx)
Gene expression during devlopment (BrainCloud)
Footnote:
A total of 269 time points ploted, with n=38 fetal samples (x=1:38). Each triangle represents one time point.
Gene expression of temporal and spatial changes (BrainSpan)
Footnote:
SC: sub-cortical regions; SM: sensory-motor regions; FC: frontal cortex; and TP: temporal-parietal cortex
ST1: fetal (13 - 26 postconception weeks), ST2: early infancy to late childhood (4 months to 11 years), and ST3: adolescence to adulthood (13 - 23 years)
The bar shown representes the lower 25% and upper 25% of the expression distribution.
Top co-expressed genes in brain regions
| Top 10 positively co-expressed genes | ||
| Gene | Pearson's Correlation | Spearman's Correlation |
| CHD2 | 0.90 | 0.93 |
| MTR | 0.89 | 0.93 |
| MACF1 | 0.88 | 0.91 |
| USP36 | 0.88 | 0.91 |
| GOLGB1 | 0.88 | 0.91 |
| BOD1L | 0.88 | 0.91 |
| CEP350 | 0.88 | 0.92 |
| PCNT | 0.88 | 0.90 |
| UBN2 | 0.88 | 0.90 |
| TNRC6A | 0.88 | 0.90 |
| Top 10 negatively co-expressed genes | ||
| Gene | Pearson's Correlation | Spearman's Correlation |
| ENHO | -0.65 | -0.70 |
| C1orf54 | -0.65 | -0.76 |
| VAMP5 | -0.64 | -0.71 |
| AF347015.21 | -0.64 | -0.70 |
| HIGD1B | -0.64 | -0.69 |
| AF347015.31 | -0.63 | -0.65 |
| IFI27 | -0.63 | -0.64 |
| RHOC | -0.62 | -0.67 |
| GNG11 | -0.61 | -0.67 |
| IGFBP7 | -0.61 | -0.67 |
Section V. Pathway annotation
| Pathway name | Pathway size | # SZGR 2.0 genes in pathway | Info |
|---|---|---|---|
| BERTUCCI MEDULLARY VS DUCTAL BREAST CANCER UP | 206 | 111 | All SZGR 2.0 genes in this pathway |
| WANG LMO4 TARGETS DN | 352 | 225 | All SZGR 2.0 genes in this pathway |
| HAMAI APOPTOSIS VIA TRAIL UP | 584 | 356 | All SZGR 2.0 genes in this pathway |
| LASTOWSKA COAMPLIFIED WITH MYCN | 43 | 29 | All SZGR 2.0 genes in this pathway |
| BENPORATH NANOG TARGETS | 988 | 594 | All SZGR 2.0 genes in this pathway |
| BENPORATH OCT4 TARGETS | 290 | 172 | All SZGR 2.0 genes in this pathway |
| BENPORATH CYCLING GENES | 648 | 385 | All SZGR 2.0 genes in this pathway |
| WANG PROSTATE CANCER ANDROGEN INDEPENDENT | 66 | 37 | All SZGR 2.0 genes in this pathway |
| IVANOVA HEMATOPOIESIS STEM CELL AND PROGENITOR | 681 | 420 | All SZGR 2.0 genes in this pathway |
| MARTINEZ RESPONSE TO TRABECTEDIN DN | 271 | 175 | All SZGR 2.0 genes in this pathway |
| MARSON BOUND BY FOXP3 UNSTIMULATED | 1229 | 713 | All SZGR 2.0 genes in this pathway |
| ACEVEDO LIVER CANCER UP | 973 | 570 | All SZGR 2.0 genes in this pathway |
| ACEVEDO LIVER TUMOR VS NORMAL ADJACENT TISSUE UP | 863 | 514 | All SZGR 2.0 genes in this pathway |
| MILI PSEUDOPODIA HAPTOTAXIS UP | 518 | 299 | All SZGR 2.0 genes in this pathway |
| BRUINS UVC RESPONSE EARLY LATE | 317 | 190 | All SZGR 2.0 genes in this pathway |