Gene Page: XPO7
Summary ?
| GeneID | 23039 |
| Symbol | XPO7 |
| Synonyms | EXP7|RANBP16 |
| Description | exportin 7 |
| Reference | MIM:606140|HGNC:HGNC:14108|Ensembl:ENSG00000130227|HPRD:05846|Vega:OTTHUMG00000163789 |
| Gene type | protein-coding |
| Map location | 8p21 |
| Pascal p-value | 0.996 |
| Sherlock p-value | 0.032 |
| TADA p-value | 0.017 |
| Fetal beta | 0.927 |
| DMG | 1 (# studies) |
| Support | CompositeSet Darnell FMRP targets |
Gene in Data Sources
| Gene set name | Method of gene set | Description | Info |
|---|---|---|---|
| CV:PGCnp | Genome-wide Association Study | GWAS | |
| DMG:Jaffe_2016 | Genome-wide DNA methylation analysis | This dataset includes 2,104 probes/CpGs associated with SZ patients (n=108) compared to 136 controls at Bonferroni-adjusted P < 0.05. | 1 |
| DNM:Fromer_2014 | Whole Exome Sequencing analysis | This study reported a WES study of 623 schizophrenia trios, reporting DNMs using genomic DNA. | |
| GSMA_I | Genome scan meta-analysis | Psr: 0.031 | |
| GSMA_IIA | Genome scan meta-analysis (All samples) | Psr: 0.03086 | |
| GSMA_IIE | Genome scan meta-analysis (European-ancestry samples) | Psr: 0.00057 |
Section I. Genetics and epigenetics annotation
 DNM table
| Gene | Chromosome | Position | Ref | Alt | Transcript | AA change | Mutation type | Sift | CG46 | Trait | Study |
|---|---|---|---|---|---|---|---|---|---|---|---|
| XPO7 | chr8 | 21849382 | A | G | NM_015024 NM_015024 | . p.682E>G | splice missense | Schizophrenia | DNM:Fromer_2014 |
Differentially methylated gene
| Probe | Chromosome | Position | Nearest gene | P (dis) | Beta (dis) | FDR (dis) | Study |
|---|---|---|---|---|---|---|---|
| cg19201477 | 8 | 21776851 | XPO7 | 3.13E-8 | -0.013 | 9.5E-6 | DMG:Jaffe_2016 |
Section II. Transcriptome annotation
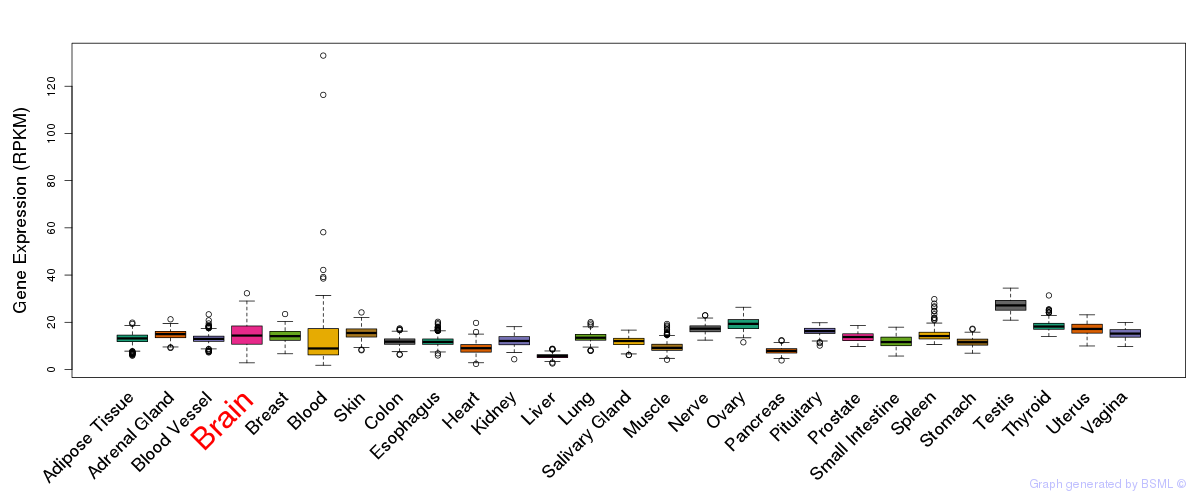
General gene expression (GTEx)
Gene expression during devlopment (BrainCloud)
Footnote:
A total of 269 time points ploted, with n=38 fetal samples (x=1:38). Each triangle represents one time point.
Gene expression of temporal and spatial changes (BrainSpan)
Footnote:
SC: sub-cortical regions; SM: sensory-motor regions; FC: frontal cortex; and TP: temporal-parietal cortex
ST1: fetal (13 - 26 postconception weeks), ST2: early infancy to late childhood (4 months to 11 years), and ST3: adolescence to adulthood (13 - 23 years)
The bar shown representes the lower 25% and upper 25% of the expression distribution.
Top co-expressed genes in brain regions
| Top 10 positively co-expressed genes | ||
| Gene | Pearson's Correlation | Spearman's Correlation |
| SCN3A | 0.91 | 0.92 |
| NAV3 | 0.90 | 0.92 |
| SOS1 | 0.90 | 0.93 |
| ACACA | 0.90 | 0.92 |
| MAP3K7IP3 | 0.90 | 0.93 |
| USP34 | 0.89 | 0.93 |
| B4GALT5 | 0.89 | 0.91 |
| C5orf42 | 0.88 | 0.91 |
| KCTD10 | 0.88 | 0.92 |
| MGEA5 | 0.88 | 0.93 |
| Top 10 negatively co-expressed genes | ||
| Gene | Pearson's Correlation | Spearman's Correlation |
| MT-CO2 | -0.70 | -0.81 |
| AF347015.31 | -0.70 | -0.79 |
| FXYD1 | -0.69 | -0.77 |
| IFI27 | -0.68 | -0.77 |
| HIGD1B | -0.68 | -0.81 |
| S100B | -0.67 | -0.74 |
| AF347015.33 | -0.66 | -0.73 |
| AC021016.1 | -0.66 | -0.76 |
| HSD17B14 | -0.66 | -0.72 |
| AF347015.27 | -0.66 | -0.74 |
Section III. Gene Ontology annotation
| Molecular function | GO term | Evidence | Neuro keywords | PubMed ID |
|---|---|---|---|---|
| GO:0005049 | nuclear export signal receptor activity | IDA | 11024021 | |
| GO:0005488 | binding | IEA | - | |
| GO:0008565 | protein transporter activity | IEA | - | |
| Biological process | GO term | Evidence | Neuro keywords | PubMed ID |
| GO:0000059 | protein import into nucleus, docking | IEA | - | |
| GO:0006611 | protein export from nucleus | IDA | 11024021 | |
| GO:0006886 | intracellular protein transport | IEA | - | |
| GO:0051028 | mRNA transport | IEA | - | |
| GO:0065002 | intracellular protein transmembrane transport | IEA | - | |
| Cellular component | GO term | Evidence | Neuro keywords | PubMed ID |
| GO:0005634 | nucleus | IDA | 11071879 | |
| GO:0005634 | nucleus | IEA | - | |
| GO:0005643 | nuclear pore | IDA | 11024021 | |
| GO:0005643 | nuclear pore | IEA | - | |
| GO:0005737 | cytoplasm | IDA | 11071879 | |
| GO:0005737 | cytoplasm | IEA | - |
Section V. Pathway annotation
| Pathway name | Pathway size | # SZGR 2.0 genes in pathway | Info |
|---|---|---|---|
| HOLLMANN APOPTOSIS VIA CD40 UP | 201 | 125 | All SZGR 2.0 genes in this pathway |
| THUM SYSTOLIC HEART FAILURE UP | 423 | 283 | All SZGR 2.0 genes in this pathway |
| KINSEY TARGETS OF EWSR1 FLII FUSION UP | 1278 | 748 | All SZGR 2.0 genes in this pathway |
| RODRIGUES THYROID CARCINOMA POORLY DIFFERENTIATED DN | 805 | 505 | All SZGR 2.0 genes in this pathway |
| GRAESSMANN APOPTOSIS BY DOXORUBICIN DN | 1781 | 1082 | All SZGR 2.0 genes in this pathway |
| GAUSSMANN MLL AF4 FUSION TARGETS D UP | 38 | 23 | All SZGR 2.0 genes in this pathway |
| PATIL LIVER CANCER | 747 | 453 | All SZGR 2.0 genes in this pathway |
| LOPEZ MBD TARGETS | 957 | 597 | All SZGR 2.0 genes in this pathway |
| BYSTRYKH HEMATOPOIESIS STEM CELL QTL TRANS | 882 | 572 | All SZGR 2.0 genes in this pathway |
| JAIN NFKB SIGNALING | 75 | 44 | All SZGR 2.0 genes in this pathway |
| ABE VEGFA TARGETS 2HR | 34 | 21 | All SZGR 2.0 genes in this pathway |
| IVANOVA HEMATOPOIESIS MATURE CELL | 293 | 160 | All SZGR 2.0 genes in this pathway |
| BLALOCK ALZHEIMERS DISEASE DN | 1237 | 837 | All SZGR 2.0 genes in this pathway |
| MARSON BOUND BY FOXP3 UNSTIMULATED | 1229 | 713 | All SZGR 2.0 genes in this pathway |
| HAN SATB1 TARGETS UP | 395 | 249 | All SZGR 2.0 genes in this pathway |
| YAMASHITA LIVER CANCER WITH EPCAM UP | 53 | 25 | All SZGR 2.0 genes in this pathway |
| CAIRO HEPATOBLASTOMA CLASSES UP | 605 | 377 | All SZGR 2.0 genes in this pathway |
| KIM BIPOLAR DISORDER OLIGODENDROCYTE DENSITY CORR UP | 682 | 440 | All SZGR 2.0 genes in this pathway |
| KIM ALL DISORDERS CALB1 CORR UP | 548 | 370 | All SZGR 2.0 genes in this pathway |
| PILON KLF1 TARGETS DN | 1972 | 1213 | All SZGR 2.0 genes in this pathway |
| BAKKER FOXO3 TARGETS UP | 61 | 41 | All SZGR 2.0 genes in this pathway |
Section VI. microRNA annotation
| miRNA family | Target position | miRNA ID | miRNA seq | ||
|---|---|---|---|---|---|
| UTR start | UTR end | Match method | |||
| miR-331 | 104 | 110 | m8 | hsa-miR-331brain | GCCCCUGGGCCUAUCCUAGAA |
| miR-381 | 318 | 325 | 1A,m8 | hsa-miR-381 | UAUACAAGGGCAAGCUCUCUGU |
| miR-493-5p | 329 | 335 | m8 | hsa-miR-493-5p | UUGUACAUGGUAGGCUUUCAUU |
- SZ: miRNAs which differentially expressed in brain cortex of schizophrenia patients comparing with control samples using microarray. Click here to see the list of SZ related miRNAs.
- Brain: miRNAs which are expressed in brain based on miRNA microarray expression studies. Click here to see the list of brain related miRNAs.