Gene Page: DCUN1D4
Summary ?
| GeneID | 23142 |
| Symbol | DCUN1D4 |
| Synonyms | - |
| Description | defective in cullin neddylation 1 domain containing 4 |
| Reference | MIM:612977|HGNC:HGNC:28998|Ensembl:ENSG00000109184|HPRD:13791|Vega:OTTHUMG00000128700 |
| Gene type | protein-coding |
| Map location | 4q12 |
| Pascal p-value | 0.865 |
| Sherlock p-value | 0.308 |
| Fetal beta | 0.103 |
| DMG | 1 (# studies) |
Gene in Data Sources
| Gene set name | Method of gene set | Description | Info |
|---|---|---|---|
| CV:PGCnp | Genome-wide Association Study | GWAS | |
| DMG:Wockner_2014 | Genome-wide DNA methylation analysis | This dataset includes 4641 differentially methylated probes corresponding to 2929 unique genes between schizophrenia patients (n=24) and controls (n=24). | 1 |
Section I. Genetics and epigenetics annotation
 Differentially methylated gene
| Probe | Chromosome | Position | Nearest gene | P (dis) | Beta (dis) | FDR (dis) | Study |
|---|---|---|---|---|---|---|---|
| ch.4.1080479F | 4 | 52742061 | DCUN1D4 | 1.468E-4 | -0.577 | 0.031 | DMG:Wockner_2014 |
Section II. Transcriptome annotation
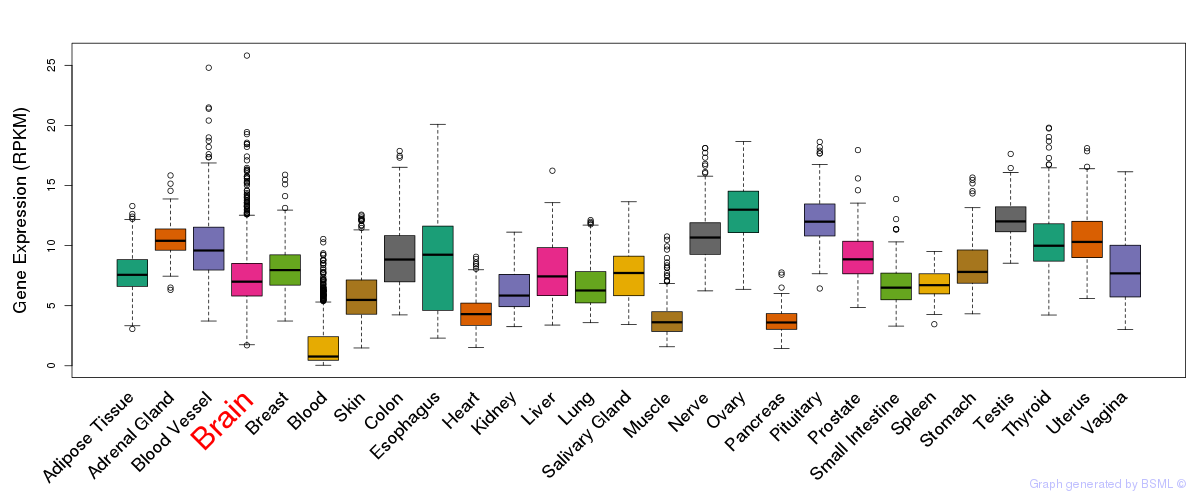
General gene expression (GTEx)
Gene expression during devlopment (BrainCloud)
Footnote:
A total of 269 time points ploted, with n=38 fetal samples (x=1:38). Each triangle represents one time point.
Gene expression of temporal and spatial changes (BrainSpan)
Footnote:
SC: sub-cortical regions; SM: sensory-motor regions; FC: frontal cortex; and TP: temporal-parietal cortex
ST1: fetal (13 - 26 postconception weeks), ST2: early infancy to late childhood (4 months to 11 years), and ST3: adolescence to adulthood (13 - 23 years)
The bar shown representes the lower 25% and upper 25% of the expression distribution.
Top co-expressed genes in brain regions
| Top 10 positively co-expressed genes | ||
| Gene | Pearson's Correlation | Spearman's Correlation |
| NFE2L1 | 0.89 | 0.92 |
| TECPR2 | 0.88 | 0.93 |
| MFSD6 | 0.88 | 0.92 |
| SPATA2 | 0.88 | 0.92 |
| ADCY9 | 0.88 | 0.91 |
| SLC9A1 | 0.86 | 0.90 |
| MAGEE1 | 0.86 | 0.88 |
| AGPAT3 | 0.86 | 0.89 |
| TRAPPC10 | 0.86 | 0.90 |
| PEG3AS | 0.86 | 0.88 |
| Top 10 negatively co-expressed genes | ||
| Gene | Pearson's Correlation | Spearman's Correlation |
| C1orf61 | -0.49 | -0.55 |
| GNG11 | -0.49 | -0.52 |
| DBI | -0.48 | -0.55 |
| ST20 | -0.48 | -0.51 |
| IL32 | -0.47 | -0.51 |
| C1orf54 | -0.47 | -0.50 |
| RPL31 | -0.47 | -0.51 |
| RPL35 | -0.47 | -0.52 |
| SYCP3 | -0.47 | -0.52 |
| PFDN5 | -0.46 | -0.44 |
Section V. Pathway annotation
| Pathway name | Pathway size | # SZGR 2.0 genes in pathway | Info |
|---|---|---|---|
| MULLIGHAN NPM1 MUTATED SIGNATURE 1 UP | 276 | 165 | All SZGR 2.0 genes in this pathway |
| MULLIGHAN MLL SIGNATURE 1 DN | 242 | 165 | All SZGR 2.0 genes in this pathway |
| MULLIGHAN MLL SIGNATURE 2 DN | 281 | 186 | All SZGR 2.0 genes in this pathway |
| MULLIGHAN NPM1 SIGNATURE 3 UP | 341 | 197 | All SZGR 2.0 genes in this pathway |
| RODRIGUES THYROID CARCINOMA POORLY DIFFERENTIATED UP | 633 | 376 | All SZGR 2.0 genes in this pathway |
| OUELLET CULTURED OVARIAN CANCER INVASIVE VS LMP UP | 69 | 40 | All SZGR 2.0 genes in this pathway |
| SCHLOSSER MYC TARGETS REPRESSED BY SERUM | 159 | 93 | All SZGR 2.0 genes in this pathway |
| DACOSTA UV RESPONSE VIA ERCC3 DN | 855 | 609 | All SZGR 2.0 genes in this pathway |
| DACOSTA UV RESPONSE VIA ERCC3 COMMON DN | 483 | 336 | All SZGR 2.0 genes in this pathway |
| NUYTTEN NIPP1 TARGETS UP | 769 | 437 | All SZGR 2.0 genes in this pathway |
| NUYTTEN EZH2 TARGETS UP | 1037 | 673 | All SZGR 2.0 genes in this pathway |
| AMIT EGF RESPONSE 60 HELA | 46 | 32 | All SZGR 2.0 genes in this pathway |
| SCHUHMACHER MYC TARGETS UP | 80 | 57 | All SZGR 2.0 genes in this pathway |
| IVANOVA HEMATOPOIESIS EARLY PROGENITOR | 532 | 309 | All SZGR 2.0 genes in this pathway |
| JOHNSTONE PARVB TARGETS 2 DN | 336 | 211 | All SZGR 2.0 genes in this pathway |
| TORCHIA TARGETS OF EWSR1 FLI1 FUSION DN | 321 | 200 | All SZGR 2.0 genes in this pathway |
| WAKABAYASHI ADIPOGENESIS PPARG BOUND 8D | 658 | 397 | All SZGR 2.0 genes in this pathway |