Gene Page: MTUS2
Summary ?
| GeneID | 23281 |
| Symbol | MTUS2 |
| Synonyms | CAZIP|ICIS|KIAA0774|TIP150 |
| Description | microtubule associated tumor suppressor candidate 2 |
| Reference | HGNC:HGNC:20595|Ensembl:ENSG00000132938|HPRD:11108|Vega:OTTHUMG00000016657 |
| Gene type | protein-coding |
| Map location | 13q12.3 |
| Pascal p-value | 0.14 |
| Fetal beta | -0.351 |
| DMG | 1 (# studies) |
Gene in Data Sources
| Gene set name | Method of gene set | Description | Info |
|---|---|---|---|
| CV:PGCnp | Genome-wide Association Study | GWAS | |
| DMG:Wockner_2014 | Genome-wide DNA methylation analysis | This dataset includes 4641 differentially methylated probes corresponding to 2929 unique genes between schizophrenia patients (n=24) and controls (n=24). | 1 |
Section I. Genetics and epigenetics annotation
 Differentially methylated gene
| Probe | Chromosome | Position | Nearest gene | P (dis) | Beta (dis) | FDR (dis) | Study |
|---|---|---|---|---|---|---|---|
| cg09694280 | 13 | 29613532 | MTUS2 | 5.403E-4 | 0.373 | 0.048 | DMG:Wockner_2014 |
Section II. Transcriptome annotation
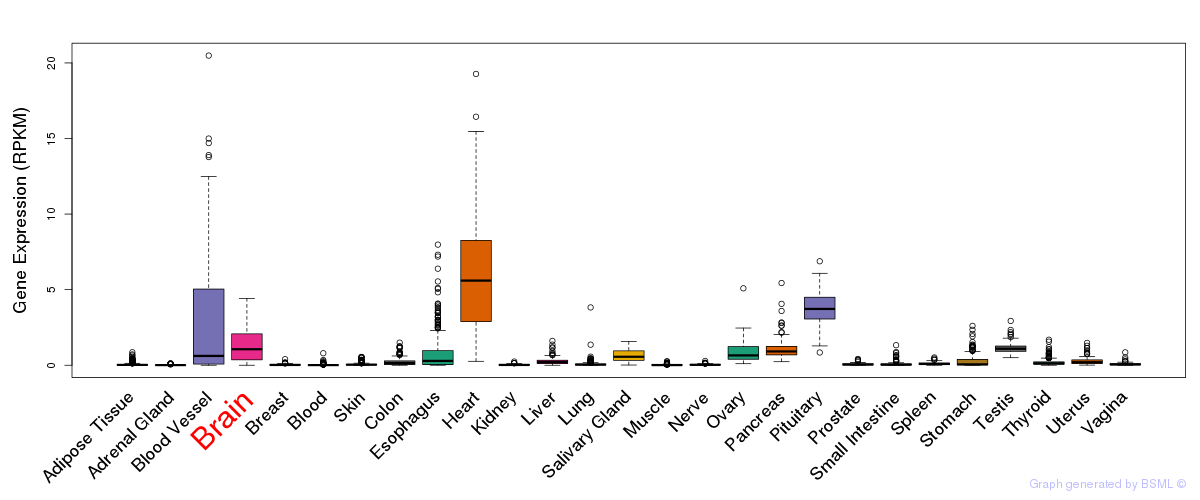
General gene expression (GTEx)
Gene expression during devlopment (BrainCloud)
Footnote:
A total of 269 time points ploted, with n=38 fetal samples (x=1:38). Each triangle represents one time point.
Gene expression of temporal and spatial changes (BrainSpan)
Footnote:
SC: sub-cortical regions; SM: sensory-motor regions; FC: frontal cortex; and TP: temporal-parietal cortex
ST1: fetal (13 - 26 postconception weeks), ST2: early infancy to late childhood (4 months to 11 years), and ST3: adolescence to adulthood (13 - 23 years)
The bar shown representes the lower 25% and upper 25% of the expression distribution.
Top co-expressed genes in brain regions
| Top 10 positively co-expressed genes | ||
| Gene | Pearson's Correlation | Spearman's Correlation |
| CSNK1G2 | 0.77 | 0.81 |
| RHOF | 0.76 | 0.78 |
| C19orf26 | 0.75 | 0.80 |
| DVL1 | 0.75 | 0.76 |
| TAOK2 | 0.75 | 0.79 |
| SOLH | 0.74 | 0.80 |
| MIB2 | 0.74 | 0.81 |
| BX927359.1 | 0.74 | 0.75 |
| JMJD8 | 0.74 | 0.79 |
| JPH3 | 0.73 | 0.76 |
| Top 10 negatively co-expressed genes | ||
| Gene | Pearson's Correlation | Spearman's Correlation |
| AF347015.21 | -0.48 | -0.37 |
| CLEC2B | -0.46 | -0.37 |
| C1orf54 | -0.43 | -0.35 |
| SYCP3 | -0.42 | -0.39 |
| GNG11 | -0.41 | -0.37 |
| AF347015.31 | -0.41 | -0.33 |
| MT-CO2 | -0.39 | -0.32 |
| AL050337.1 | -0.37 | -0.33 |
| AF347015.8 | -0.37 | -0.29 |
| AF347015.27 | -0.36 | -0.31 |
Section V. Pathway annotation
| Pathway name | Pathway size | # SZGR 2.0 genes in pathway | Info |
|---|---|---|---|
| GAUSSMANN MLL AF4 FUSION TARGETS E UP | 97 | 60 | All SZGR 2.0 genes in this pathway |
| PEREZ TP53 TARGETS | 1174 | 695 | All SZGR 2.0 genes in this pathway |
| EBAUER TARGETS OF PAX3 FOXO1 FUSION DN | 48 | 31 | All SZGR 2.0 genes in this pathway |
| MARTORIATI MDM4 TARGETS FETAL LIVER DN | 514 | 319 | All SZGR 2.0 genes in this pathway |
| BONOME OVARIAN CANCER SURVIVAL OPTIMAL DEBULKING | 246 | 152 | All SZGR 2.0 genes in this pathway |
| YAGI AML WITH INV 16 TRANSLOCATION | 422 | 277 | All SZGR 2.0 genes in this pathway |
| MEISSNER NPC HCP WITH H3K4ME2 | 491 | 319 | All SZGR 2.0 genes in this pathway |
| ZWANG TRANSIENTLY UP BY 2ND EGF PULSE ONLY | 1725 | 838 | All SZGR 2.0 genes in this pathway |