Gene Page: EHBP1
Summary ?
| GeneID | 23301 |
| Symbol | EHBP1 |
| Synonyms | HPC12|NACSIN |
| Description | EH domain binding protein 1 |
| Reference | MIM:609922|HGNC:HGNC:29144|Ensembl:ENSG00000115504|HPRD:10109|Vega:OTTHUMG00000129453 |
| Gene type | protein-coding |
| Map location | 2p15 |
| Pascal p-value | 0.004 |
| Sherlock p-value | 0.621 |
| DEG p-value | DEG:Sanders_2014:DS1_p=0.190:DS1_beta=0.003570:DS2_p=5.15e-02:DS2_beta=0.092:DS2_FDR=2.01e-01 |
| Fetal beta | 0.175 |
| DMG | 1 (# studies) |
| Support | Ascano FMRP targets |
Gene in Data Sources
| Gene set name | Method of gene set | Description | Info |
|---|---|---|---|
| CV:PGCnp | Genome-wide Association Study | GWAS | |
| DEG:Sanders_2013 | Microarray | Whole-genome gene expression profiles using microarrays on lymphoblastoid cell lines (LCLs) from 413 cases and 446 controls. | |
| DMG:Wockner_2014 | Genome-wide DNA methylation analysis | This dataset includes 4641 differentially methylated probes corresponding to 2929 unique genes between schizophrenia patients (n=24) and controls (n=24). | 1 |
Section I. Genetics and epigenetics annotation
 Differentially methylated gene
| Probe | Chromosome | Position | Nearest gene | P (dis) | Beta (dis) | FDR (dis) | Study |
|---|---|---|---|---|---|---|---|
| cg22162225 | 2 | 62932835 | EHBP1 | 9.38E-6 | -0.292 | 0.013 | DMG:Wockner_2014 |
Section II. Transcriptome annotation
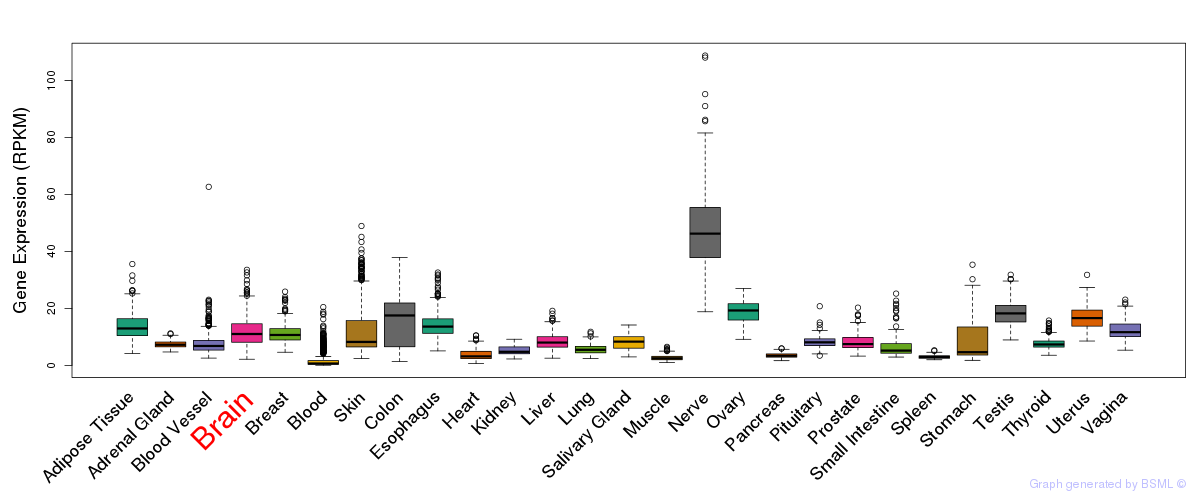
General gene expression (GTEx)
Gene expression during devlopment (BrainCloud)
Footnote:
A total of 269 time points ploted, with n=38 fetal samples (x=1:38). Each triangle represents one time point.
Gene expression of temporal and spatial changes (BrainSpan)
Footnote:
SC: sub-cortical regions; SM: sensory-motor regions; FC: frontal cortex; and TP: temporal-parietal cortex
ST1: fetal (13 - 26 postconception weeks), ST2: early infancy to late childhood (4 months to 11 years), and ST3: adolescence to adulthood (13 - 23 years)
The bar shown representes the lower 25% and upper 25% of the expression distribution.
Top co-expressed genes in brain regions
| Top 10 positively co-expressed genes | ||
| Gene | Pearson's Correlation | Spearman's Correlation |
| SPP1 | 0.69 | 0.59 |
| CD68 | 0.63 | 0.31 |
| PLA2G7 | 0.63 | 0.51 |
| HPSE | 0.62 | 0.35 |
| CD14 | 0.60 | 0.41 |
| HCK | 0.59 | 0.39 |
| CD37 | 0.59 | 0.52 |
| TREM2 | 0.58 | 0.45 |
| CHIT1 | 0.57 | 0.40 |
| CD300LF | 0.56 | 0.30 |
| Top 10 negatively co-expressed genes | ||
| Gene | Pearson's Correlation | Spearman's Correlation |
| TTLL2 | -0.24 | -0.35 |
| SLA | -0.24 | -0.30 |
| SATB2 | -0.24 | -0.21 |
| MPPED1 | -0.24 | -0.26 |
| CSRP2 | -0.24 | -0.47 |
| KLHL1 | -0.24 | -0.30 |
| DACT1 | -0.23 | -0.29 |
| SCUBE1 | -0.23 | -0.37 |
| SNX7 | -0.23 | -0.36 |
| DAB1 | -0.23 | -0.33 |
Section V. Pathway annotation
| Pathway name | Pathway size | # SZGR 2.0 genes in pathway | Info |
|---|---|---|---|
| TURASHVILI BREAST NORMAL DUCTAL VS LOBULAR DN | 7 | 6 | All SZGR 2.0 genes in this pathway |
| CHARAFE BREAST CANCER LUMINAL VS BASAL DN | 455 | 304 | All SZGR 2.0 genes in this pathway |
| CHARAFE BREAST CANCER LUMINAL VS MESENCHYMAL DN | 460 | 312 | All SZGR 2.0 genes in this pathway |
| DOANE BREAST CANCER CLASSES DN | 34 | 26 | All SZGR 2.0 genes in this pathway |
| RHEIN ALL GLUCOCORTICOID THERAPY DN | 362 | 238 | All SZGR 2.0 genes in this pathway |
| DACOSTA UV RESPONSE VIA ERCC3 DN | 855 | 609 | All SZGR 2.0 genes in this pathway |
| DACOSTA UV RESPONSE VIA ERCC3 COMMON DN | 483 | 336 | All SZGR 2.0 genes in this pathway |
| SCHAEFFER PROSTATE DEVELOPMENT AND CANCER BOX5 UP | 11 | 7 | All SZGR 2.0 genes in this pathway |
| BENPORATH NANOG TARGETS | 988 | 594 | All SZGR 2.0 genes in this pathway |
| LIU SMARCA4 TARGETS | 64 | 39 | All SZGR 2.0 genes in this pathway |
| GENTILE UV LOW DOSE DN | 67 | 46 | All SZGR 2.0 genes in this pathway |
| IZADPANAH STEM CELL ADIPOSE VS BONE DN | 108 | 68 | All SZGR 2.0 genes in this pathway |
| BRUECKNER TARGETS OF MIRLET7A3 UP | 111 | 69 | All SZGR 2.0 genes in this pathway |
| TOOKER GEMCITABINE RESISTANCE DN | 122 | 84 | All SZGR 2.0 genes in this pathway |
| CAIRO LIVER DEVELOPMENT UP | 166 | 105 | All SZGR 2.0 genes in this pathway |
| MIKKELSEN ES ICP WITH H3K4ME3 | 718 | 401 | All SZGR 2.0 genes in this pathway |
| MIKKELSEN NPC ICP WITH H3K4ME3 | 445 | 257 | All SZGR 2.0 genes in this pathway |
| KIM BIPOLAR DISORDER OLIGODENDROCYTE DENSITY CORR UP | 682 | 440 | All SZGR 2.0 genes in this pathway |
| KIM ALL DISORDERS CALB1 CORR UP | 548 | 370 | All SZGR 2.0 genes in this pathway |
| JOHNSTONE PARVB TARGETS 2 DN | 336 | 211 | All SZGR 2.0 genes in this pathway |
| MIYAGAWA TARGETS OF EWSR1 ETS FUSIONS DN | 229 | 135 | All SZGR 2.0 genes in this pathway |
| GOBERT OLIGODENDROCYTE DIFFERENTIATION DN | 1080 | 713 | All SZGR 2.0 genes in this pathway |