Gene Page: RIMBP2
Summary ?
| GeneID | 23504 |
| Symbol | RIMBP2 |
| Synonyms | PPP1R133|RBP2|RIM-BP2 |
| Description | RIMS binding protein 2 |
| Reference | MIM:611602|HGNC:HGNC:30339|Ensembl:ENSG00000060709|HPRD:17183|Vega:OTTHUMG00000168385 |
| Gene type | protein-coding |
| Map location | 12q24.33 |
| Pascal p-value | 0.074 |
| Sherlock p-value | 0.863 |
| Fetal beta | -0.776 |
| DMG | 1 (# studies) |
| eGene | Myers' cis & trans |
| Support | G2Cdb.human_BAYES-COLLINS-HUMAN-PSD-CONSENSUS G2Cdb.human_BAYES-COLLINS-HUMAN-PSD-FULL G2Cdb.human_BAYES-COLLINS-MOUSE-PSD-CONSENSUS CompositeSet Darnell FMRP targets |
Gene in Data Sources
| Gene set name | Method of gene set | Description | Info |
|---|---|---|---|
| CV:GWASdb | Genome-wide Association Studies | GWASdb records for schizophrenia | |
| CV:PGCnp | Genome-wide Association Study | GWAS | |
| DMG:Jaffe_2016 | Genome-wide DNA methylation analysis | This dataset includes 2,104 probes/CpGs associated with SZ patients (n=108) compared to 136 controls at Bonferroni-adjusted P < 0.05. | 1 |
Section I. Genetics and epigenetics annotation
 Differentially methylated gene
| Probe | Chromosome | Position | Nearest gene | P (dis) | Beta (dis) | FDR (dis) | Study |
|---|---|---|---|---|---|---|---|
| cg14256008 | 12 | 131200631 | RIMBP2 | 5.85E-8 | -0.012 | 1.49E-5 | DMG:Jaffe_2016 |
eQTL annotation
| SNP ID | Chromosome | Position | eGene | Gene Entrez ID | pvalue | qvalue | TSS distance | eQTL type |
|---|---|---|---|---|---|---|---|---|
| rs36781 | chr5 | 109289728 | RIMBP2 | 23504 | 0.15 | trans |
Section II. Transcriptome annotation
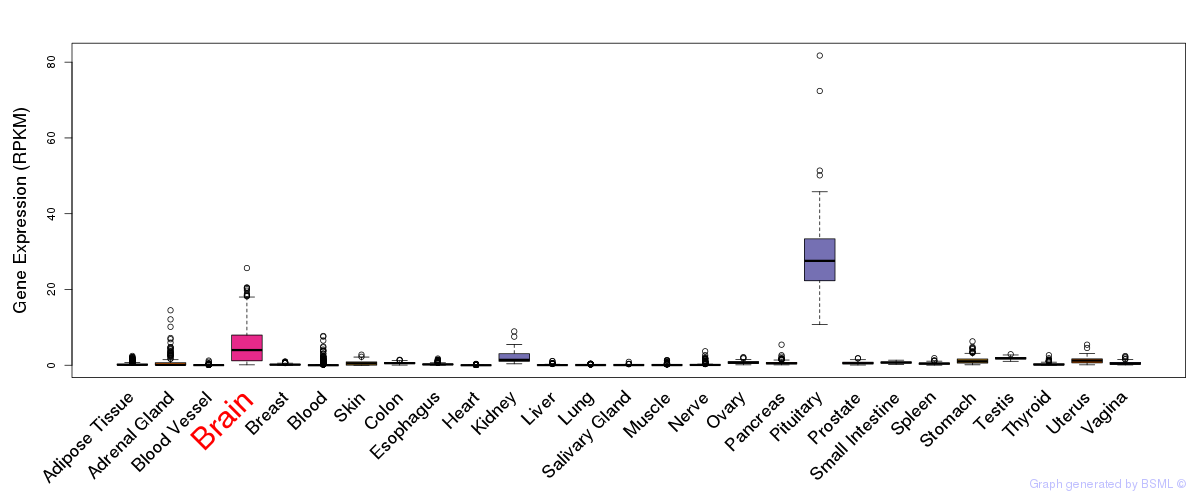
General gene expression (GTEx)
Gene expression during devlopment (BrainCloud)
Footnote:
A total of 269 time points ploted, with n=38 fetal samples (x=1:38). Each triangle represents one time point.
Gene expression of temporal and spatial changes (BrainSpan)
Footnote:
SC: sub-cortical regions; SM: sensory-motor regions; FC: frontal cortex; and TP: temporal-parietal cortex
ST1: fetal (13 - 26 postconception weeks), ST2: early infancy to late childhood (4 months to 11 years), and ST3: adolescence to adulthood (13 - 23 years)
The bar shown representes the lower 25% and upper 25% of the expression distribution.
No co-expressed genes in brain regions
Section V. Pathway annotation
| Pathway name | Pathway size | # SZGR 2.0 genes in pathway | Info |
|---|---|---|---|
| PEREZ TP53 TARGETS | 1174 | 695 | All SZGR 2.0 genes in this pathway |
| MEINHOLD OVARIAN CANCER LOW GRADE UP | 19 | 15 | All SZGR 2.0 genes in this pathway |
| STARK PREFRONTAL CORTEX 22Q11 DELETION UP | 195 | 138 | All SZGR 2.0 genes in this pathway |
| RORIE TARGETS OF EWSR1 FLI1 FUSION DN | 30 | 23 | All SZGR 2.0 genes in this pathway |
| COATES MACROPHAGE M1 VS M2 DN | 78 | 44 | All SZGR 2.0 genes in this pathway |
| MCCABE BOUND BY HOXC6 | 469 | 239 | All SZGR 2.0 genes in this pathway |
| NAKAYAMA SOFT TISSUE TUMORS PCA1 DN | 74 | 47 | All SZGR 2.0 genes in this pathway |
| KIM ALL DISORDERS OLIGODENDROCYTE NUMBER CORR UP | 756 | 494 | All SZGR 2.0 genes in this pathway |