Gene Page: SIT1
Summary ?
| GeneID | 27240 |
| Symbol | SIT1 |
| Synonyms | SIT|SIT-R |
| Description | signaling threshold regulating transmembrane adaptor 1 |
| Reference | MIM:604964|HGNC:HGNC:17710|Ensembl:ENSG00000137078|HPRD:05394|Vega:OTTHUMG00000019867 |
| Gene type | protein-coding |
| Map location | 9p13-p12 |
| Pascal p-value | 0.147 |
| Fetal beta | -0.116 |
| DMG | 2 (# studies) |
| eGene | Myers' cis & trans |
Gene in Data Sources
| Gene set name | Method of gene set | Description | Info |
|---|---|---|---|
| CV:PGCnp | Genome-wide Association Study | GWAS | |
| DMG:vanEijk_2014 | Genome-wide DNA methylation analysis | This dataset includes 432 differentially methylated CpG sites corresponding to 391 unique transcripts between schizophrenia patients (n=260) and unaffected controls (n=250). | 3 |
| DMG:Wockner_2014 | Genome-wide DNA methylation analysis | This dataset includes 4641 differentially methylated probes corresponding to 2929 unique genes between schizophrenia patients (n=24) and controls (n=24). | 3 |
Section I. Genetics and epigenetics annotation
 Differentially methylated gene
| Probe | Chromosome | Position | Nearest gene | P (dis) | Beta (dis) | FDR (dis) | Study |
|---|---|---|---|---|---|---|---|
| cg05992079 | 9 | 35650999 | SIT1 | 1.262E-4 | -0.355 | 0.03 | DMG:Wockner_2014 |
| cg12876594 | 9 | 35791798 | SIT1 | 9.19E-4 | 2.014 | DMG:vanEijk_2014 | |
| cg15518883 | 9 | 35650561 | SIT1 | 8.13E-5 | -2.344 | DMG:vanEijk_2014 |
eQTL annotation
| SNP ID | Chromosome | Position | eGene | Gene Entrez ID | pvalue | qvalue | TSS distance | eQTL type |
|---|---|---|---|---|---|---|---|---|
| rs1507047 | chr16 | 50932778 | SIT1 | 27240 | 0.13 | trans |
Section II. Transcriptome annotation
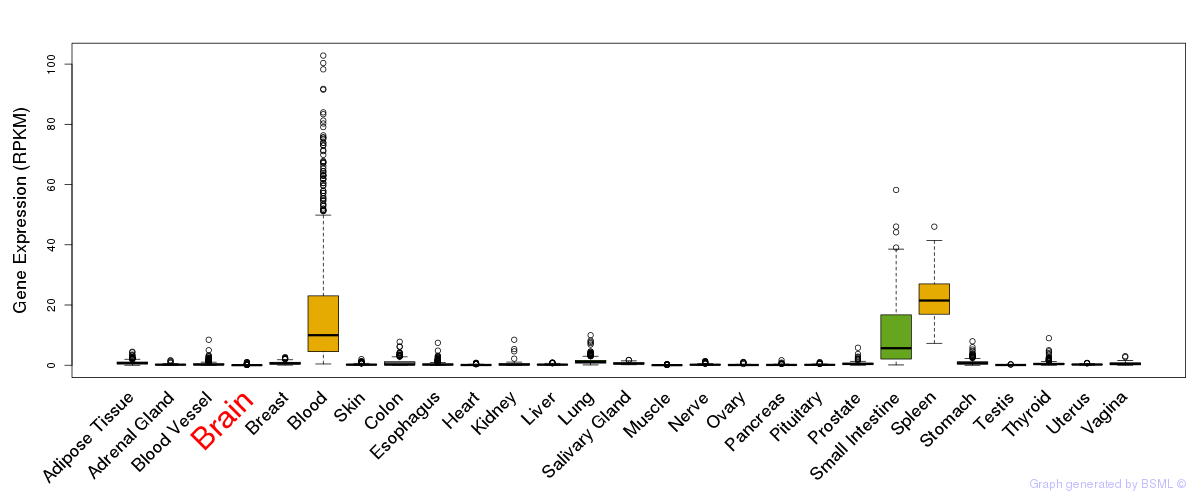
General gene expression (GTEx)
Gene expression during devlopment (BrainCloud)
Footnote:
A total of 269 time points ploted, with n=38 fetal samples (x=1:38). Each triangle represents one time point.
Gene expression of temporal and spatial changes (BrainSpan)
Footnote:
SC: sub-cortical regions; SM: sensory-motor regions; FC: frontal cortex; and TP: temporal-parietal cortex
ST1: fetal (13 - 26 postconception weeks), ST2: early infancy to late childhood (4 months to 11 years), and ST3: adolescence to adulthood (13 - 23 years)
The bar shown representes the lower 25% and upper 25% of the expression distribution.
No co-expressed genes in brain regions
Section V. Pathway annotation
| Pathway name | Pathway size | # SZGR 2.0 genes in pathway | Info |
|---|---|---|---|
| BILBAN B CLL LPL UP | 63 | 39 | All SZGR 2.0 genes in this pathway |
| SABATES COLORECTAL ADENOMA DN | 291 | 176 | All SZGR 2.0 genes in this pathway |
| PUJANA BRCA1 PCC NETWORK | 1652 | 1023 | All SZGR 2.0 genes in this pathway |
| PUJANA ATM PCC NETWORK | 1442 | 892 | All SZGR 2.0 genes in this pathway |
| SHEN SMARCA2 TARGETS DN | 357 | 212 | All SZGR 2.0 genes in this pathway |
| KLEIN PRIMARY EFFUSION LYMPHOMA DN | 58 | 42 | All SZGR 2.0 genes in this pathway |
| PENG RAPAMYCIN RESPONSE DN | 245 | 154 | All SZGR 2.0 genes in this pathway |
| KUMAR TARGETS OF MLL AF9 FUSION | 405 | 264 | All SZGR 2.0 genes in this pathway |
| SMID BREAST CANCER LUMINAL B DN | 564 | 326 | All SZGR 2.0 genes in this pathway |
| SMID BREAST CANCER NORMAL LIKE UP | 476 | 285 | All SZGR 2.0 genes in this pathway |
| KASLER HDAC7 TARGETS 1 UP | 194 | 133 | All SZGR 2.0 genes in this pathway |
| SMIRNOV RESPONSE TO IR 6HR DN | 114 | 69 | All SZGR 2.0 genes in this pathway |