Gene Page: NRBP1
Summary ?
| GeneID | 29959 |
| Symbol | NRBP1 |
| Synonyms | BCON3|MADM|MUDPNP|NRBP |
| Description | nuclear receptor binding protein 1 |
| Reference | MIM:606010|HGNC:HGNC:7993|Ensembl:ENSG00000115216|HPRD:05819|Vega:OTTHUMG00000097789 |
| Gene type | protein-coding |
| Map location | 2p23 |
| Pascal p-value | 5.064E-4 |
| Sherlock p-value | 0.583 |
| DEG p-value | DEG:Maycox_2009:CC_BA10_fold_change=-1.22:CC_BA10_disease_P=0.0038:HBB_BA9_fold_change=-1.25:HBB_BA9_disease_P=0.0313 |
| Fetal beta | -0.193 |
Gene in Data Sources
| Gene set name | Method of gene set | Description | Info |
|---|---|---|---|
| CV:PGCnp | Genome-wide Association Study | GWAS | |
| DEG:Maycox_2009 | Microarray to determine the expression of over 30000 mRNA transcripts in post-mortem tissue | We included 51 genes whose expression changes are common between two schizophrenia cohorts. | |
| GO_Annotation | Mapping neuro-related keywords to Gene Ontology annotations | Hits with neuro-related keywords: 1 |
Section I. Genetics and epigenetics annotation
Section II. Transcriptome annotation
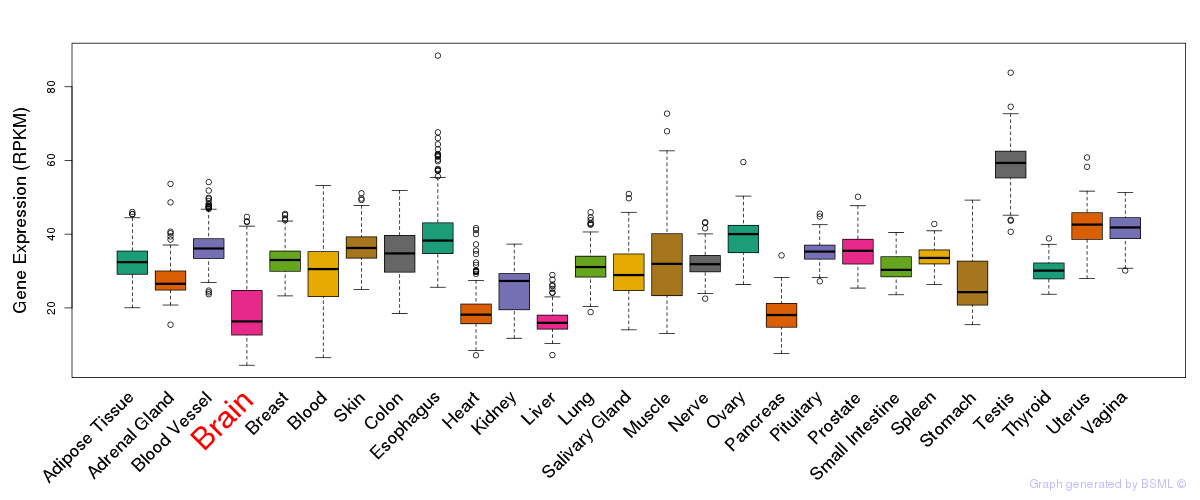
General gene expression (GTEx)

Gene expression during devlopment (BrainCloud)
Footnote:
A total of 269 time points ploted, with n=38 fetal samples (x=1:38). Each triangle represents one time point.
Gene expression of temporal and spatial changes (BrainSpan)
Footnote:
SC: sub-cortical regions; SM: sensory-motor regions; FC: frontal cortex; and TP: temporal-parietal cortex
ST1: fetal (13 - 26 postconception weeks), ST2: early infancy to late childhood (4 months to 11 years), and ST3: adolescence to adulthood (13 - 23 years)
The bar shown representes the lower 25% and upper 25% of the expression distribution.
No co-expressed genes in brain regions
Section III. Gene Ontology annotation
| Molecular function | GO term | Evidence | Neuro keywords | PubMed ID |
|---|---|---|---|---|
| GO:0005515 | protein binding | IPI | 11956649 |15084397 |17353931 | |
| GO:0005524 | ATP binding | IEA | - | |
| GO:0004672 | protein kinase activity | IEA | - | |
| GO:0042803 | protein homodimerization activity | ISS | - | |
| Biological process | GO term | Evidence | Neuro keywords | PubMed ID |
| GO:0006468 | protein amino acid phosphorylation | IEA | - | |
| GO:0006888 | ER to Golgi vesicle-mediated transport | IDA | 11956649 | |
| Cellular component | GO term | Evidence | Neuro keywords | PubMed ID |
| GO:0042995 | cell projection | IEA | axon (GO term level: 4) | - |
| GO:0012505 | endomembrane system | IDA | 11956649 | |
| GO:0005737 | cytoplasm | IEA | - | |
| GO:0016020 | membrane | IEA | - | |
| GO:0048471 | perinuclear region of cytoplasm | IEA | - |
Section V. Pathway annotation
| Pathway name | Pathway size | # SZGR 2.0 genes in pathway | Info |
|---|---|---|---|
| REACTOME GENERIC TRANSCRIPTION PATHWAY | 352 | 181 | All SZGR 2.0 genes in this pathway |
| REACTOME NUCLEAR RECEPTOR TRANSCRIPTION PATHWAY | 49 | 36 | All SZGR 2.0 genes in this pathway |
| WANG LMO4 TARGETS DN | 352 | 225 | All SZGR 2.0 genes in this pathway |
| SENESE HDAC1 TARGETS DN | 260 | 143 | All SZGR 2.0 genes in this pathway |
| WANG ESOPHAGUS CANCER VS NORMAL DN | 101 | 66 | All SZGR 2.0 genes in this pathway |
| MARSON BOUND BY FOXP3 STIMULATED | 1022 | 619 | All SZGR 2.0 genes in this pathway |
| GRADE METASTASIS DN | 45 | 31 | All SZGR 2.0 genes in this pathway |
| FIRESTEIN PROLIFERATION | 175 | 125 | All SZGR 2.0 genes in this pathway |
| JUBAN TARGETS OF SPI1 AND FLI1 UP | 115 | 73 | All SZGR 2.0 genes in this pathway |
| KUMAR PATHOGEN LOAD BY MACROPHAGES | 275 | 155 | All SZGR 2.0 genes in this pathway |