Gene Page: CHSY3
Summary ?
| GeneID | 337876 |
| Symbol | CHSY3 |
| Synonyms | CHSY2|CSS3 |
| Description | chondroitin sulfate synthase 3 |
| Reference | MIM:609963|HGNC:HGNC:24293|Ensembl:ENSG00000198108|HPRD:16766|Vega:OTTHUMG00000163043 |
| Gene type | protein-coding |
| Map location | 5q23.3 |
| Pascal p-value | 0.215 |
| Fetal beta | -0.203 |
| DMG | 2 (# studies) |
| eGene | Myers' cis & trans |
| Support | Ascano FMRP targets |
Gene in Data Sources
| Gene set name | Method of gene set | Description | Info |
|---|---|---|---|
| CV:PGCnp | Genome-wide Association Study | GWAS | |
| DMG:Jaffe_2016 | Genome-wide DNA methylation analysis | This dataset includes 2,104 probes/CpGs associated with SZ patients (n=108) compared to 136 controls at Bonferroni-adjusted P < 0.05. | 2 |
| DMG:Wockner_2014 | Genome-wide DNA methylation analysis | This dataset includes 4641 differentially methylated probes corresponding to 2929 unique genes between schizophrenia patients (n=24) and controls (n=24). | 2 |
Section I. Genetics and epigenetics annotation
 DNM table
| Gene | Chromosome | Position | Ref | Alt | Transcript | AA change | Mutation type | Sift | CG46 | Trait | Study |
|---|---|---|---|---|---|---|---|---|---|---|---|
| CHSY3 | chr5 | 129521214 | A | G | NM_175856 | . | silent | Schizophrenia | DNM:Fromer_2014 |
Differentially methylated gene
| Probe | Chromosome | Position | Nearest gene | P (dis) | Beta (dis) | FDR (dis) | Study |
|---|---|---|---|---|---|---|---|
| cg06610705 | 5 | 129244050 | CHSY3 | 9.09E-5 | 0.597 | 0.027 | DMG:Wockner_2014 |
| cg24642372 | 5 | 129241297 | CHSY3 | 1.61E-9 | -0.011 | 1.46E-6 | DMG:Jaffe_2016 |
eQTL annotation
| SNP ID | Chromosome | Position | eGene | Gene Entrez ID | pvalue | qvalue | TSS distance | eQTL type |
|---|---|---|---|---|---|---|---|---|
| rs6956115 | chr7 | 96521010 | CHSY3 | 337876 | 0.1 | trans | ||
| rs139572 | chr22 | 42214531 | CHSY3 | 337876 | 0.12 | trans |
Section II. Transcriptome annotation
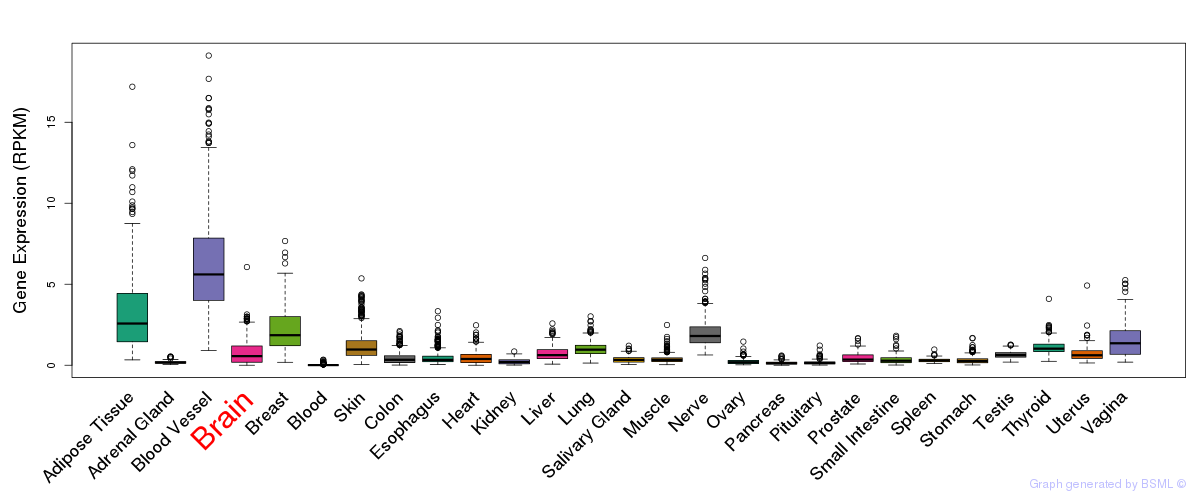
General gene expression (GTEx)
Gene expression during devlopment (BrainCloud)
Footnote:
A total of 269 time points ploted, with n=38 fetal samples (x=1:38). Each triangle represents one time point.
Gene expression of temporal and spatial changes (BrainSpan)
Footnote:
SC: sub-cortical regions; SM: sensory-motor regions; FC: frontal cortex; and TP: temporal-parietal cortex
ST1: fetal (13 - 26 postconception weeks), ST2: early infancy to late childhood (4 months to 11 years), and ST3: adolescence to adulthood (13 - 23 years)
The bar shown representes the lower 25% and upper 25% of the expression distribution.
No co-expressed genes in brain regions
Section V. Pathway annotation
| Pathway name | Pathway size | # SZGR 2.0 genes in pathway | Info |
|---|---|---|---|
| KEGG GLYCOSAMINOGLYCAN BIOSYNTHESIS CHONDROITIN SULFATE | 22 | 16 | All SZGR 2.0 genes in this pathway |
| REACTOME CHONDROITIN SULFATE BIOSYNTHESIS | 21 | 15 | All SZGR 2.0 genes in this pathway |
| REACTOME CHONDROITIN SULFATE DERMATAN SULFATE METABOLISM | 49 | 33 | All SZGR 2.0 genes in this pathway |
| REACTOME GLYCOSAMINOGLYCAN METABOLISM | 111 | 69 | All SZGR 2.0 genes in this pathway |
| REACTOME METABOLISM OF CARBOHYDRATES | 247 | 154 | All SZGR 2.0 genes in this pathway |
| CHEBOTAEV GR TARGETS DN | 120 | 73 | All SZGR 2.0 genes in this pathway |
| SCHAEFFER PROSTATE DEVELOPMENT 48HR DN | 428 | 306 | All SZGR 2.0 genes in this pathway |
| GEORGES TARGETS OF MIR192 AND MIR215 | 893 | 528 | All SZGR 2.0 genes in this pathway |
| LIM MAMMARY STEM CELL UP | 489 | 314 | All SZGR 2.0 genes in this pathway |