Gene Page: AQP6
Summary ?
| GeneID | 363 |
| Symbol | AQP6 |
| Synonyms | AQP2L|KID |
| Description | aquaporin 6 |
| Reference | MIM:601383|HGNC:HGNC:639|Ensembl:ENSG00000086159|HPRD:03226| |
| Gene type | protein-coding |
| Map location | 12q13 |
| Pascal p-value | 0.166 |
| Fetal beta | -1.117 |
| DMG | 1 (# studies) |
Gene in Data Sources
| Gene set name | Method of gene set | Description | Info |
|---|---|---|---|
| CV:PGCnp | Genome-wide Association Study | GWAS | |
| DMG:Montano_2016 | Genome-wide DNA methylation analysis | This dataset includes 172 replicated associations between CpGs with schizophrenia. | 1 |
Section I. Genetics and epigenetics annotation
 Differentially methylated gene
| Probe | Chromosome | Position | Nearest gene | P (dis) | Beta (dis) | FDR (dis) | Study |
|---|---|---|---|---|---|---|---|
| cg04462774 | 12 | 50368110 | AQP6 | 5.22E-5 | 0.005 | 0.098 | DMG:Montano_2016 |
Section II. Transcriptome annotation
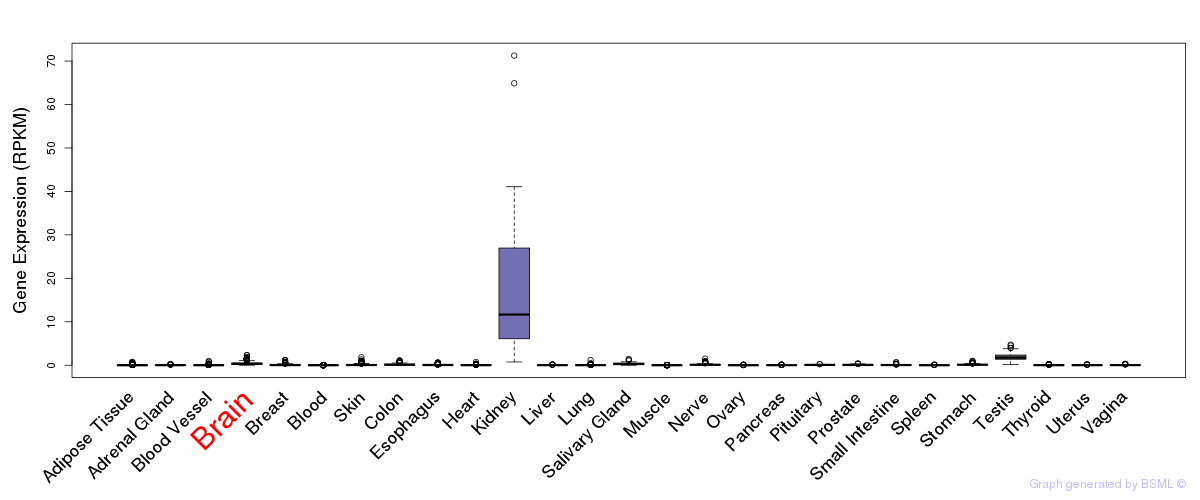
General gene expression (GTEx)
Gene expression during devlopment (BrainCloud)
Footnote:
A total of 269 time points ploted, with n=38 fetal samples (x=1:38). Each triangle represents one time point.
Gene expression of temporal and spatial changes (BrainSpan)
Footnote:
SC: sub-cortical regions; SM: sensory-motor regions; FC: frontal cortex; and TP: temporal-parietal cortex
ST1: fetal (13 - 26 postconception weeks), ST2: early infancy to late childhood (4 months to 11 years), and ST3: adolescence to adulthood (13 - 23 years)
The bar shown representes the lower 25% and upper 25% of the expression distribution.
Top co-expressed genes in brain regions
| Top 10 positively co-expressed genes | ||
| Gene | Pearson's Correlation | Spearman's Correlation |
| KIAA0748 | 0.78 | 0.78 |
| HTR3B | 0.77 | 0.73 |
| CASQ1 | 0.76 | 0.69 |
| RGS4 | 0.76 | 0.77 |
| PAH | 0.76 | 0.76 |
| ABCC12 | 0.74 | 0.70 |
| HTR2A | 0.73 | 0.64 |
| AC103681.1 | 0.73 | 0.72 |
| TMEM155 | 0.73 | 0.67 |
| AC148477.2 | 0.73 | 0.61 |
| Top 10 negatively co-expressed genes | ||
| Gene | Pearson's Correlation | Spearman's Correlation |
| BCL7C | -0.42 | -0.62 |
| FADS2 | -0.42 | -0.49 |
| PKN1 | -0.40 | -0.59 |
| PDE9A | -0.39 | -0.65 |
| SEMA4B | -0.39 | -0.46 |
| FAM59B | -0.39 | -0.44 |
| SH3BP2 | -0.39 | -0.64 |
| GPR125 | -0.38 | -0.45 |
| TSPAN4 | -0.38 | -0.50 |
| GLIS2 | -0.38 | -0.53 |
Section V. Pathway annotation
| Pathway name | Pathway size | # SZGR 2.0 genes in pathway | Info |
|---|---|---|---|
| REACTOME TRANSMEMBRANE TRANSPORT OF SMALL MOLECULES | 413 | 270 | All SZGR 2.0 genes in this pathway |
| REACTOME PASSIVE TRANSPORT BY AQUAPORINS | 11 | 7 | All SZGR 2.0 genes in this pathway |
| REACTOME AQUAPORIN MEDIATED TRANSPORT | 51 | 34 | All SZGR 2.0 genes in this pathway |
| PARENT MTOR SIGNALING DN | 46 | 29 | All SZGR 2.0 genes in this pathway |
| ENK UV RESPONSE KERATINOCYTE UP | 530 | 342 | All SZGR 2.0 genes in this pathway |
| EBAUER TARGETS OF PAX3 FOXO1 FUSION UP | 207 | 128 | All SZGR 2.0 genes in this pathway |
| SHEN SMARCA2 TARGETS DN | 357 | 212 | All SZGR 2.0 genes in this pathway |
| BLALOCK ALZHEIMERS DISEASE UP | 1691 | 1088 | All SZGR 2.0 genes in this pathway |
| YOSHIMURA MAPK8 TARGETS UP | 1305 | 895 | All SZGR 2.0 genes in this pathway |
| SHEDDEN LUNG CANCER GOOD SURVIVAL A12 | 317 | 177 | All SZGR 2.0 genes in this pathway |
| CHIANG LIVER CANCER SUBCLASS CTNNB1 UP | 176 | 110 | All SZGR 2.0 genes in this pathway |
| MIKKELSEN MEF ICP WITH H3K27ME3 | 206 | 108 | All SZGR 2.0 genes in this pathway |
| MIKKELSEN ES ICP WITH H3K4ME3 AND H3K27ME3 | 137 | 85 | All SZGR 2.0 genes in this pathway |
| MARTENS TRETINOIN RESPONSE UP | 857 | 456 | All SZGR 2.0 genes in this pathway |