Gene Page: KCNC3
Summary ?
| GeneID | 3748 |
| Symbol | KCNC3 |
| Synonyms | KSHIIID|KV3.3|SCA13 |
| Description | potassium voltage-gated channel subfamily C member 3 |
| Reference | MIM:176264|HGNC:HGNC:6235|Ensembl:ENSG00000131398|HPRD:08886|Vega:OTTHUMG00000044580 |
| Gene type | protein-coding |
| Map location | 19q13.33 |
| Pascal p-value | 0.018 |
| Fetal beta | -0.842 |
| DMG | 1 (# studies) |
| eGene | Myers' cis & trans |
| Support | CompositeSet Darnell FMRP targets |
Gene in Data Sources
| Gene set name | Method of gene set | Description | Info |
|---|---|---|---|
| CV:PGCnp | Genome-wide Association Study | GWAS | |
| DMG:Wockner_2014 | Genome-wide DNA methylation analysis | This dataset includes 4641 differentially methylated probes corresponding to 2929 unique genes between schizophrenia patients (n=24) and controls (n=24). | 1 |
Section I. Genetics and epigenetics annotation
 Differentially methylated gene
| Probe | Chromosome | Position | Nearest gene | P (dis) | Beta (dis) | FDR (dis) | Study |
|---|---|---|---|---|---|---|---|
| cg13378394 | 19 | 50831811 | KCNC3 | 1.485E-4 | -0.242 | 0.032 | DMG:Wockner_2014 |
eQTL annotation
| SNP ID | Chromosome | Position | eGene | Gene Entrez ID | pvalue | qvalue | TSS distance | eQTL type |
|---|---|---|---|---|---|---|---|---|
| rs17714461 | chr19 | 51425105 | KCNC3 | 3748 | 0.08 | cis |
Section II. Transcriptome annotation
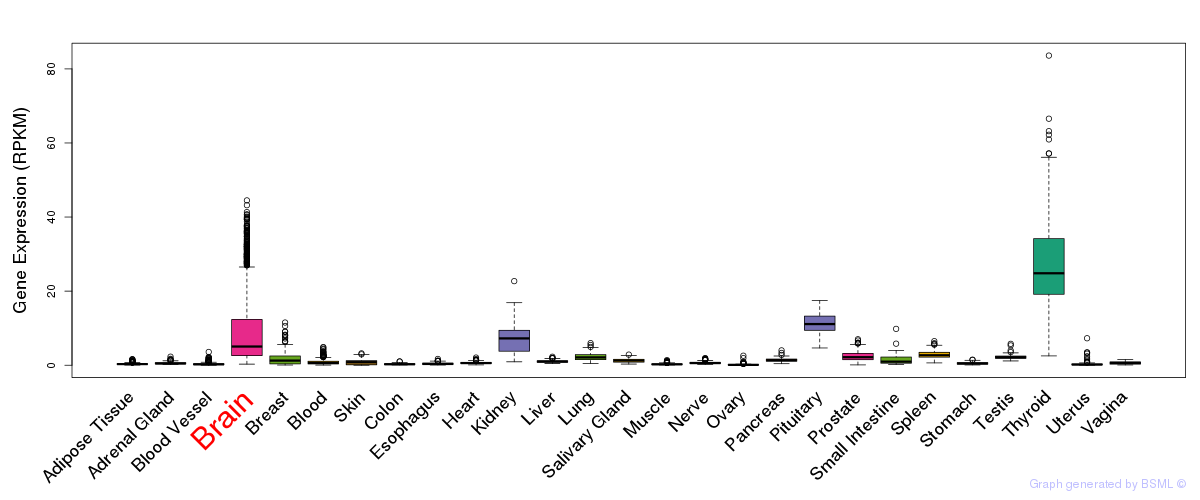
General gene expression (GTEx)
Gene expression during devlopment (BrainCloud)
Footnote:
A total of 269 time points ploted, with n=38 fetal samples (x=1:38). Each triangle represents one time point.
Gene expression of temporal and spatial changes (BrainSpan)
Footnote:
SC: sub-cortical regions; SM: sensory-motor regions; FC: frontal cortex; and TP: temporal-parietal cortex
ST1: fetal (13 - 26 postconception weeks), ST2: early infancy to late childhood (4 months to 11 years), and ST3: adolescence to adulthood (13 - 23 years)
The bar shown representes the lower 25% and upper 25% of the expression distribution.
Top co-expressed genes in brain regions
| Top 10 positively co-expressed genes | ||
| Gene | Pearson's Correlation | Spearman's Correlation |
| GLUD1 | 0.86 | 0.83 |
| GJA1 | 0.81 | 0.79 |
| EDNRB | 0.81 | 0.84 |
| GLUD2 | 0.81 | 0.81 |
| PLSCR4 | 0.80 | 0.83 |
| RAB31 | 0.79 | 0.83 |
| S1PR1 | 0.78 | 0.71 |
| SLC15A2 | 0.77 | 0.81 |
| SUCLG2 | 0.76 | 0.76 |
| PIPOX | 0.76 | 0.78 |
| Top 10 negatively co-expressed genes | ||
| Gene | Pearson's Correlation | Spearman's Correlation |
| RTF1 | -0.44 | -0.58 |
| DBN1 | -0.40 | -0.53 |
| TMEM81 | -0.40 | -0.53 |
| LDB1 | -0.40 | -0.53 |
| BZW2 | -0.40 | -0.56 |
| USF1 | -0.40 | -0.55 |
| UCK2 | -0.40 | -0.53 |
| ZNF589 | -0.40 | -0.50 |
| GMEB1 | -0.40 | -0.52 |
| DPF1 | -0.39 | -0.51 |
Section V. Pathway annotation
| Pathway name | Pathway size | # SZGR 2.0 genes in pathway | Info |
|---|---|---|---|
| REACTOME NEURONAL SYSTEM | 279 | 221 | All SZGR 2.0 genes in this pathway |
| REACTOME VOLTAGE GATED POTASSIUM CHANNELS | 43 | 32 | All SZGR 2.0 genes in this pathway |
| REACTOME POTASSIUM CHANNELS | 98 | 68 | All SZGR 2.0 genes in this pathway |
| YOSHIMURA MAPK8 TARGETS UP | 1305 | 895 | All SZGR 2.0 genes in this pathway |
| MEISSNER BRAIN HCP WITH H3K4ME3 AND H3K27ME3 | 1069 | 729 | All SZGR 2.0 genes in this pathway |
| MIKKELSEN MCV6 HCP WITH H3K27ME3 | 435 | 318 | All SZGR 2.0 genes in this pathway |
| MIKKELSEN MEF HCP WITH H3K27ME3 | 590 | 403 | All SZGR 2.0 genes in this pathway |