Gene Page: ODF1
Summary ?
| GeneID | 4956 |
| Symbol | ODF1 |
| Synonyms | CT133|HSPB10|ODF|ODF2|ODF27|ODFP|ODFPG|ODFPGA|ODFPGB|RT7|SODF |
| Description | outer dense fiber of sperm tails 1 |
| Reference | MIM:182878|HGNC:HGNC:8113|Ensembl:ENSG00000155087|HPRD:01687|Vega:OTTHUMG00000164719 |
| Gene type | protein-coding |
| Map location | 8q22.3 |
| Pascal p-value | 0.744 |
| Fetal beta | 0.424 |
| eGene | Putamen basal ganglia Meta |
Gene in Data Sources
| Gene set name | Method of gene set | Description | Info |
|---|---|---|---|
| CV:GWASdb | Genome-wide Association Studies | GWASdb records for schizophrenia | |
| CV:PGCnp | Genome-wide Association Study | GWAS |
Section I. Genetics and epigenetics annotation
 eQTL annotation
| SNP ID | Chromosome | Position | eGene | Gene Entrez ID | pvalue | qvalue | TSS distance | eQTL type |
|---|---|---|---|---|---|---|---|---|
| rs189013343 | 8 | 104512428 | ODF1 | ENSG00000155087.3 | 3.3529E-6 | 0.04 | 948628 | gtex_brain_putamen_basal |
Section II. Transcriptome annotation
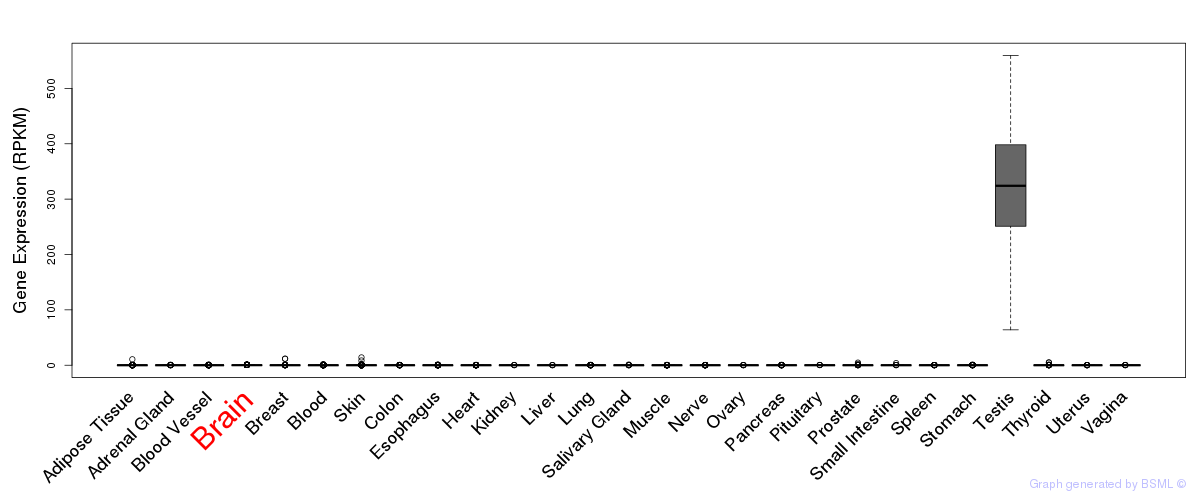
General gene expression (GTEx)
Gene expression during devlopment (BrainCloud)
Footnote:
A total of 269 time points ploted, with n=38 fetal samples (x=1:38). Each triangle represents one time point.
Gene expression of temporal and spatial changes (BrainSpan)
Footnote:
SC: sub-cortical regions; SM: sensory-motor regions; FC: frontal cortex; and TP: temporal-parietal cortex
ST1: fetal (13 - 26 postconception weeks), ST2: early infancy to late childhood (4 months to 11 years), and ST3: adolescence to adulthood (13 - 23 years)
The bar shown representes the lower 25% and upper 25% of the expression distribution.
Top co-expressed genes in brain regions
| Top 10 positively co-expressed genes | ||
| Gene | Pearson's Correlation | Spearman's Correlation |
| TCF7L2 | 0.87 | 0.43 |
| FIGN | 0.85 | 0.62 |
| GBX2 | 0.82 | 0.31 |
| LHX9 | 0.82 | 0.12 |
| RNF220 | 0.79 | 0.55 |
| SYT9 | 0.79 | 0.53 |
| RGS8 | 0.79 | 0.60 |
| COL23A1 | 0.79 | 0.46 |
| CPNE4 | 0.78 | 0.66 |
| FUT1 | 0.77 | 0.62 |
| Top 10 negatively co-expressed genes | ||
| Gene | Pearson's Correlation | Spearman's Correlation |
| SIGIRR | -0.26 | -0.52 |
| EMX2 | -0.23 | -0.49 |
| ST6GALNAC4 | -0.22 | -0.26 |
| EFEMP2 | -0.22 | -0.35 |
| GLIPR2 | -0.22 | -0.24 |
| NME4 | -0.21 | -0.51 |
| RPS20 | -0.21 | -0.45 |
| NAPRT1 | -0.21 | -0.26 |
| RPL31 | -0.21 | -0.39 |
| C6orf48 | -0.20 | -0.31 |
Section V. Pathway annotation
| Pathway name | Pathway size | # SZGR 2.0 genes in pathway | Info |
|---|---|---|---|
| OUELLET CULTURED OVARIAN CANCER INVASIVE VS LMP DN | 35 | 20 | All SZGR 2.0 genes in this pathway |
| NIKOLSKY BREAST CANCER 8Q12 Q22 AMPLICON | 132 | 82 | All SZGR 2.0 genes in this pathway |
| ASTIER INTEGRIN SIGNALING | 59 | 44 | All SZGR 2.0 genes in this pathway |
| POS RESPONSE TO HISTAMINE UP | 13 | 10 | All SZGR 2.0 genes in this pathway |
| ACEVEDO METHYLATED IN LIVER CANCER DN | 940 | 425 | All SZGR 2.0 genes in this pathway |
| YOSHIMURA MAPK8 TARGETS UP | 1305 | 895 | All SZGR 2.0 genes in this pathway |
| MIKKELSEN MCV6 ICP WITH H3K27ME3 | 74 | 46 | All SZGR 2.0 genes in this pathway |
| MARTENS TRETINOIN RESPONSE UP | 857 | 456 | All SZGR 2.0 genes in this pathway |
| KUMAR PATHOGEN LOAD BY MACROPHAGES | 275 | 155 | All SZGR 2.0 genes in this pathway |