Gene Page: GON4L
Summary ?
| GeneID | 54856 |
| Symbol | GON4L |
| Synonyms | GON-4|GON4|YARP |
| Description | gon-4 like |
| Reference | MIM:610393|HGNC:HGNC:25973|Ensembl:ENSG00000116580|HPRD:13370|Vega:OTTHUMG00000014106 |
| Gene type | protein-coding |
| Map location | 1q22 |
| Fetal beta | 0.522 |
| DMG | 1 (# studies) |
| eGene | Myers' cis & trans |
| Support | Ascano FMRP targets |
Gene in Data Sources
| Gene set name | Method of gene set | Description | Info |
|---|---|---|---|
| CV:PGCnp | Genome-wide Association Study | GWAS | |
| DMG:Wockner_2014 | Genome-wide DNA methylation analysis | This dataset includes 4641 differentially methylated probes corresponding to 2929 unique genes between schizophrenia patients (n=24) and controls (n=24). | 1 |
| GSMA_I | Genome scan meta-analysis | Psr: 0.0235 | |
| GSMA_IIA | Genome scan meta-analysis (All samples) | Psr: 0.00814 |
Section I. Genetics and epigenetics annotation
 Differentially methylated gene
| Probe | Chromosome | Position | Nearest gene | P (dis) | Beta (dis) | FDR (dis) | Study |
|---|---|---|---|---|---|---|---|
| cg12062067 | 1 | 155814285 | GON4L | 2.267E-4 | 0.289 | 0.036 | DMG:Wockner_2014 |
 eQTL annotation
| SNP ID | Chromosome | Position | eGene | Gene Entrez ID | pvalue | qvalue | TSS distance | eQTL type |
|---|---|---|---|---|---|---|---|---|
| rs16869851 | chr4 | 20690056 | GON4L | 54856 | 0.03 | trans |
Section II. Transcriptome annotation
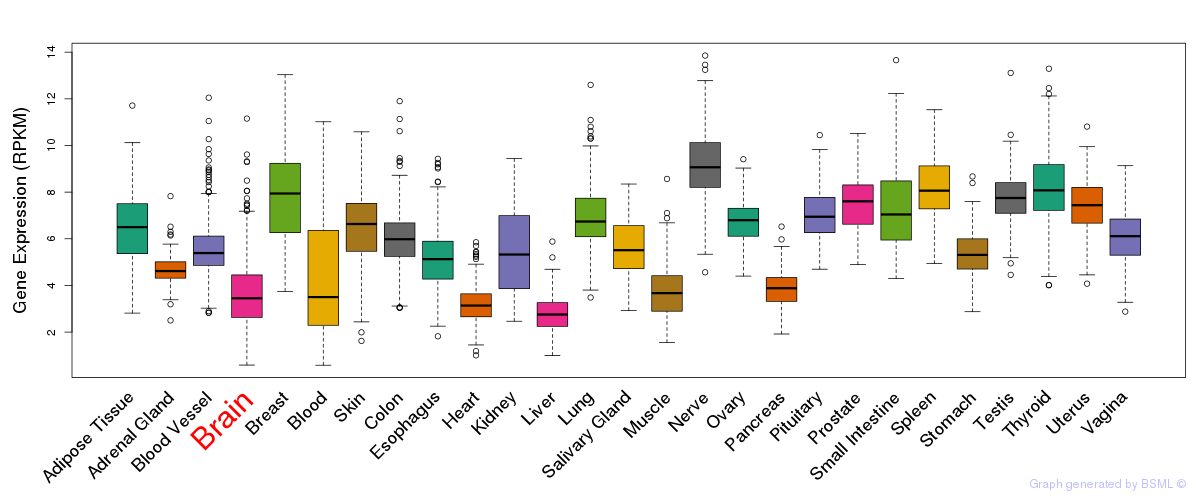
General gene expression (GTEx)

Gene expression during devlopment (BrainCloud)
Footnote:
A total of 269 time points ploted, with n=38 fetal samples (x=1:38). Each triangle represents one time point.
Gene expression of temporal and spatial changes (BrainSpan)
Footnote:
SC: sub-cortical regions; SM: sensory-motor regions; FC: frontal cortex; and TP: temporal-parietal cortex
ST1: fetal (13 - 26 postconception weeks), ST2: early infancy to late childhood (4 months to 11 years), and ST3: adolescence to adulthood (13 - 23 years)
The bar shown representes the lower 25% and upper 25% of the expression distribution.
Top co-expressed genes in brain regions
| Top 10 positively co-expressed genes | ||
| Gene | Pearson's Correlation | Spearman's Correlation |
| FLOT1 | 0.83 | 0.85 |
| CDK5 | 0.82 | 0.84 |
| METTL11A | 0.82 | 0.83 |
| STOML1 | 0.82 | 0.84 |
| MANBAL | 0.82 | 0.84 |
| OAZ1 | 0.82 | 0.82 |
| PMM1 | 0.81 | 0.81 |
| MTCH1 | 0.80 | 0.84 |
| C12orf44 | 0.79 | 0.78 |
| OTUB1 | 0.79 | 0.83 |
| Top 10 negatively co-expressed genes | ||
| Gene | Pearson's Correlation | Spearman's Correlation |
| AF347015.18 | -0.52 | -0.32 |
| AC010300.1 | -0.49 | -0.50 |
| AF347015.26 | -0.46 | -0.28 |
| AC016705.1 | -0.44 | -0.34 |
| NSBP1 | -0.44 | -0.40 |
| AF347015.2 | -0.43 | -0.24 |
| NOSTRIN | -0.43 | -0.31 |
| AP000769.2 | -0.43 | -0.48 |
| EIF5B | -0.42 | -0.48 |
| C10orf108 | -0.41 | -0.38 |
Section III. Gene Ontology annotation
| Molecular function | GO term | Evidence | Neuro keywords | PubMed ID |
|---|---|---|---|---|
| GO:0003677 | DNA binding | IEA | - | |
| Biological process | GO term | Evidence | Neuro keywords | PubMed ID |
| GO:0006355 | regulation of transcription, DNA-dependent | IEA | - | |
| Cellular component | GO term | Evidence | Neuro keywords | PubMed ID |
| GO:0005634 | nucleus | IEA | - |
Section V. Pathway annotation
| Pathway name | Pathway size | # SZGR 2.0 genes in pathway | Info |
|---|---|---|---|
| RODRIGUES THYROID CARCINOMA POORLY DIFFERENTIATED DN | 805 | 505 | All SZGR 2.0 genes in this pathway |
| VANHARANTA UTERINE FIBROID WITH 7Q DELETION UP | 67 | 37 | All SZGR 2.0 genes in this pathway |
| PATIL LIVER CANCER | 747 | 453 | All SZGR 2.0 genes in this pathway |
| TERAMOTO OPN TARGETS CLUSTER 5 | 7 | 5 | All SZGR 2.0 genes in this pathway |
| BUYTAERT PHOTODYNAMIC THERAPY STRESS UP | 811 | 508 | All SZGR 2.0 genes in this pathway |
| SCHAEFFER PROSTATE DEVELOPMENT 6HR DN | 514 | 330 | All SZGR 2.0 genes in this pathway |
| SCHAEFFER PROSTATE DEVELOPMENT 48HR DN | 428 | 306 | All SZGR 2.0 genes in this pathway |
| KOYAMA SEMA3B TARGETS DN | 411 | 249 | All SZGR 2.0 genes in this pathway |
| MONNIER POSTRADIATION TUMOR ESCAPE UP | 393 | 244 | All SZGR 2.0 genes in this pathway |
| SHEDDEN LUNG CANCER GOOD SURVIVAL A4 | 196 | 124 | All SZGR 2.0 genes in this pathway |
| BRUINS UVC RESPONSE VIA TP53 GROUP A | 898 | 516 | All SZGR 2.0 genes in this pathway |
| BILANGES SERUM SENSITIVE VIA TSC2 | 39 | 25 | All SZGR 2.0 genes in this pathway |
| WAKABAYASHI ADIPOGENESIS PPARG RXRA BOUND 8D | 882 | 506 | All SZGR 2.0 genes in this pathway |
Section VI. microRNA annotation
| miRNA family | Target position | miRNA ID | miRNA seq | ||
|---|---|---|---|---|---|
| UTR start | UTR end | Match method | |||
| miR-324-5p | 646 | 652 | m8 | hsa-miR-324-5p | CGCAUCCCCUAGGGCAUUGGUGU |
- SZ: miRNAs which differentially expressed in brain cortex of schizophrenia patients comparing with control samples using microarray. Click here to see the list of SZ related miRNAs.
- Brain: miRNAs which are expressed in brain based on miRNA microarray expression studies. Click here to see the list of brain related miRNAs.