Gene Page: CHCHD3
Summary ?
| GeneID | 54927 |
| Symbol | CHCHD3 |
| Synonyms | MINOS3|Mic19|PPP1R22 |
| Description | coiled-coil-helix-coiled-coil-helix domain containing 3 |
| Reference | MIM:613748|HGNC:HGNC:21906|Ensembl:ENSG00000106554|HPRD:13044|Vega:OTTHUMG00000155231 |
| Gene type | protein-coding |
| Map location | 7q33 |
| Pascal p-value | 0.068 |
| Sherlock p-value | 0.027 |
| Fetal beta | 0.338 |
| Support | G2Cdb.human_BAYES-COLLINS-HUMAN-PSD-CONSENSUS G2Cdb.human_BAYES-COLLINS-HUMAN-PSD-FULL G2Cdb.human_BAYES-COLLINS-MOUSE-PSD-CONSENSUS CompositeSet |
Gene in Data Sources
| Gene set name | Method of gene set | Description | Info |
|---|---|---|---|
| CV:PGCnp | Genome-wide Association Study | GWAS |
Section I. Genetics and epigenetics annotation
Section II. Transcriptome annotation
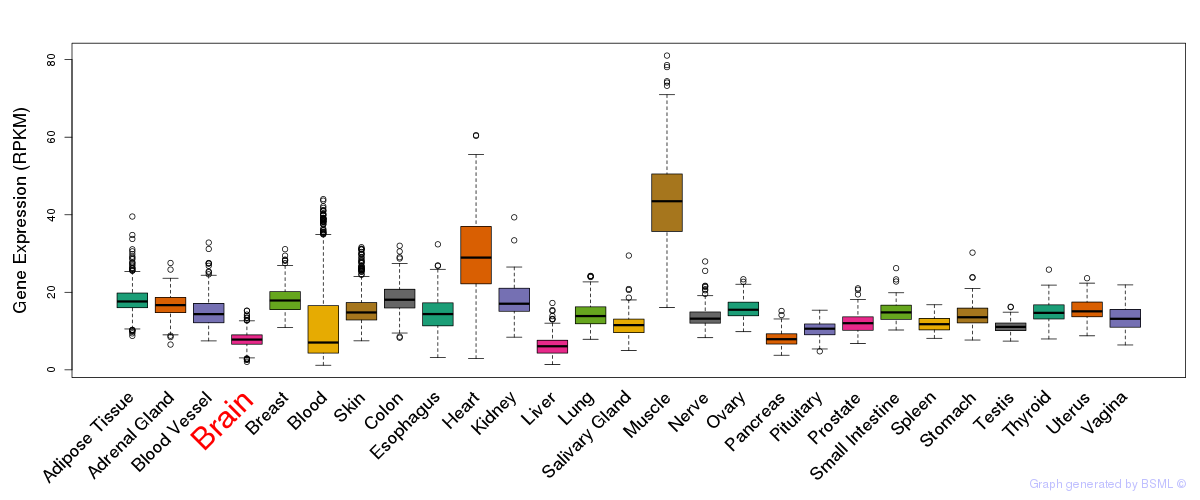
General gene expression (GTEx)
Gene expression during devlopment (BrainCloud)
Footnote:
A total of 269 time points ploted, with n=38 fetal samples (x=1:38). Each triangle represents one time point.
Gene expression of temporal and spatial changes (BrainSpan)
Footnote:
SC: sub-cortical regions; SM: sensory-motor regions; FC: frontal cortex; and TP: temporal-parietal cortex
ST1: fetal (13 - 26 postconception weeks), ST2: early infancy to late childhood (4 months to 11 years), and ST3: adolescence to adulthood (13 - 23 years)
The bar shown representes the lower 25% and upper 25% of the expression distribution.
Top co-expressed genes in brain regions
| Top 10 positively co-expressed genes | ||
| Gene | Pearson's Correlation | Spearman's Correlation |
| TAF1 | 0.89 | 0.91 |
| C6orf61 | 0.89 | 0.89 |
| ATM | 0.89 | 0.91 |
| EYA3 | 0.89 | 0.89 |
| WAPAL | 0.89 | 0.90 |
| KDM3B | 0.89 | 0.90 |
| SMC1A | 0.89 | 0.86 |
| PCM1 | 0.89 | 0.91 |
| NEK4 | 0.88 | 0.91 |
| BTBD7 | 0.88 | 0.90 |
| Top 10 negatively co-expressed genes | ||
| Gene | Pearson's Correlation | Spearman's Correlation |
| AF347015.31 | -0.66 | -0.77 |
| IFI27 | -0.65 | -0.76 |
| MT-CO2 | -0.64 | -0.75 |
| HIGD1B | -0.63 | -0.75 |
| AF347015.21 | -0.63 | -0.79 |
| AF347015.27 | -0.62 | -0.72 |
| MT-CYB | -0.62 | -0.71 |
| AF347015.8 | -0.61 | -0.73 |
| FXYD1 | -0.61 | -0.72 |
| AF347015.33 | -0.60 | -0.69 |
Section V. Pathway annotation
| Pathway name | Pathway size | # SZGR 2.0 genes in pathway | Info |
|---|---|---|---|
| CASORELLI ACUTE PROMYELOCYTIC LEUKEMIA DN | 663 | 425 | All SZGR 2.0 genes in this pathway |
| RHEIN ALL GLUCOCORTICOID THERAPY DN | 362 | 238 | All SZGR 2.0 genes in this pathway |
| DODD NASOPHARYNGEAL CARCINOMA DN | 1375 | 806 | All SZGR 2.0 genes in this pathway |
| RODRIGUES THYROID CARCINOMA POORLY DIFFERENTIATED UP | 633 | 376 | All SZGR 2.0 genes in this pathway |
| GRAESSMANN APOPTOSIS BY DOXORUBICIN DN | 1781 | 1082 | All SZGR 2.0 genes in this pathway |
| NUYTTEN NIPP1 TARGETS UP | 769 | 437 | All SZGR 2.0 genes in this pathway |
| GARCIA TARGETS OF FLI1 AND DAX1 DN | 176 | 104 | All SZGR 2.0 genes in this pathway |
| BURTON ADIPOGENESIS 6 | 189 | 112 | All SZGR 2.0 genes in this pathway |
| STEIN ESRRA TARGETS UP | 388 | 234 | All SZGR 2.0 genes in this pathway |
| ACEVEDO LIVER CANCER UP | 973 | 570 | All SZGR 2.0 genes in this pathway |
| CHUNG BLISTER CYTOTOXICITY UP | 134 | 84 | All SZGR 2.0 genes in this pathway |
| STEIN ESRRA TARGETS | 535 | 325 | All SZGR 2.0 genes in this pathway |
| NAKAMURA ADIPOGENESIS LATE UP | 104 | 67 | All SZGR 2.0 genes in this pathway |
| LI INDUCED T TO NATURAL KILLER DN | 116 | 83 | All SZGR 2.0 genes in this pathway |
| LU EZH2 TARGETS DN | 414 | 237 | All SZGR 2.0 genes in this pathway |
| BRUINS UVC RESPONSE LATE | 1137 | 655 | All SZGR 2.0 genes in this pathway |
| WAKABAYASHI ADIPOGENESIS PPARG RXRA BOUND 8D | 882 | 506 | All SZGR 2.0 genes in this pathway |
| WAKABAYASHI ADIPOGENESIS PPARG RXRA BOUND WITH H4K20ME1 MARK | 145 | 82 | All SZGR 2.0 genes in this pathway |