Gene Page: EDEM2
Summary ?
| GeneID | 55741 |
| Symbol | EDEM2 |
| Synonyms | C20orf31|C20orf49|bA4204.1 |
| Description | ER degradation enhancer, mannosidase alpha-like 2 |
| Reference | MIM:610302|HGNC:HGNC:15877|Ensembl:ENSG00000088298|HPRD:09841|Vega:OTTHUMG00000032322 |
| Gene type | protein-coding |
| Map location | 20q11.22 |
| Pascal p-value | 0.052 |
| Sherlock p-value | 0.344 |
| Fetal beta | 0.356 |
| eGene | Cortex Frontal Cortex BA9 Nucleus accumbens basal ganglia Myers' cis & trans Meta |
| Support | CompositeSet |
Gene in Data Sources
| Gene set name | Method of gene set | Description | Info |
|---|---|---|---|
| CV:PGCnp | Genome-wide Association Study | GWAS | |
| DNM:Xu_2012 | Whole Exome Sequencing analysis | De novo mutations of 4 genes were identified by exome sequencing of 795 samples in this study |
Section I. Genetics and epigenetics annotation
 DNM table
| Gene | Chromosome | Position | Ref | Alt | Transcript | AA change | Mutation type | Sift | CG46 | Trait | Study |
|---|---|---|---|---|---|---|---|---|---|---|---|
| EDEM2 | chr20 | 33703457 | A | G | NM_001145025 NM_018217 NR_026728 | p.469Y>H p.506Y>H . | missense missense npcRNA | Schizophrenia | DNM:Xu_2012 |
eQTL annotation
| SNP ID | Chromosome | Position | eGene | Gene Entrez ID | pvalue | qvalue | TSS distance | eQTL type |
|---|---|---|---|---|---|---|---|---|
| rs16829545 | chr2 | 151977407 | EDEM2 | 55741 | 2.249E-9 | trans | ||
| rs3845734 | chr2 | 171125572 | EDEM2 | 55741 | 0.05 | trans | ||
| rs7584986 | chr2 | 184111432 | EDEM2 | 55741 | 0.18 | trans | ||
| rs10513250 | chr3 | 144593246 | EDEM2 | 55741 | 0.09 | trans | ||
| rs17762315 | chr5 | 76807576 | EDEM2 | 55741 | 0 | trans | ||
| rs7021724 | chr9 | 2527899 | EDEM2 | 55741 | 0.16 | trans | ||
| rs2393316 | chr10 | 59333070 | EDEM2 | 55741 | 0.17 | trans | ||
| rs16955618 | chr15 | 29937543 | EDEM2 | 55741 | 5.245E-13 | trans |
Section II. Transcriptome annotation
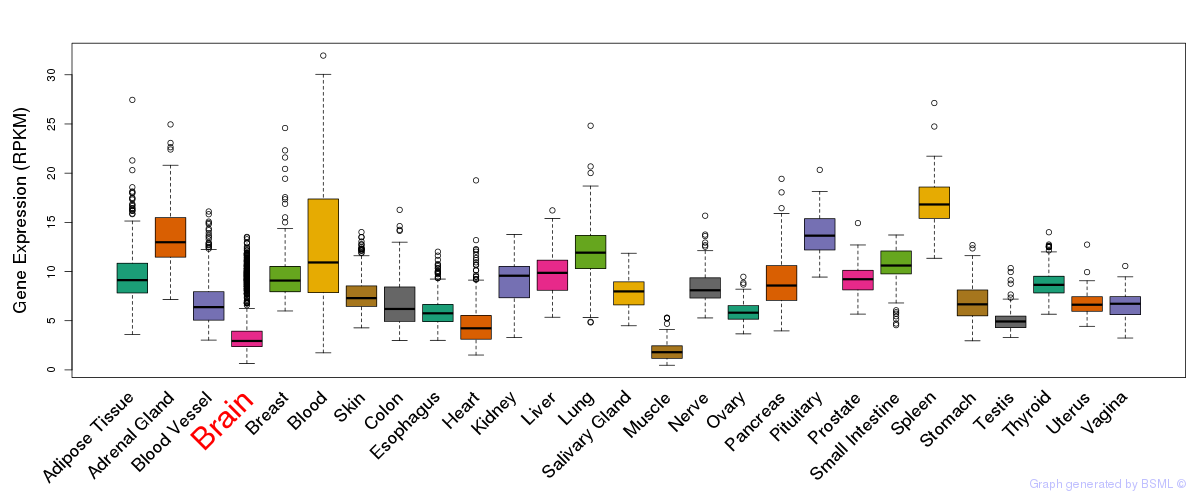
General gene expression (GTEx)
Gene expression during devlopment (BrainCloud)
Footnote:
A total of 269 time points ploted, with n=38 fetal samples (x=1:38). Each triangle represents one time point.
Gene expression of temporal and spatial changes (BrainSpan)
Footnote:
SC: sub-cortical regions; SM: sensory-motor regions; FC: frontal cortex; and TP: temporal-parietal cortex
ST1: fetal (13 - 26 postconception weeks), ST2: early infancy to late childhood (4 months to 11 years), and ST3: adolescence to adulthood (13 - 23 years)
The bar shown representes the lower 25% and upper 25% of the expression distribution.
Top co-expressed genes in brain regions
| Top 10 positively co-expressed genes | ||
| Gene | Pearson's Correlation | Spearman's Correlation |
| FOXK2 | 0.95 | 0.96 |
| CSNK1D | 0.94 | 0.95 |
| CNNM4 | 0.94 | 0.95 |
| USP22 | 0.93 | 0.95 |
| DGCR2 | 0.93 | 0.94 |
| NLGN2 | 0.93 | 0.93 |
| BICD2 | 0.93 | 0.94 |
| TGFBRAP1 | 0.93 | 0.95 |
| RUSC2 | 0.93 | 0.93 |
| TNPO2 | 0.92 | 0.93 |
| Top 10 negatively co-expressed genes | ||
| Gene | Pearson's Correlation | Spearman's Correlation |
| AF347015.31 | -0.77 | -0.81 |
| MT-CO2 | -0.75 | -0.80 |
| HIGD1B | -0.73 | -0.79 |
| FXYD1 | -0.72 | -0.77 |
| AF347015.21 | -0.72 | -0.85 |
| MT-CYB | -0.72 | -0.77 |
| AF347015.33 | -0.72 | -0.75 |
| AF347015.8 | -0.71 | -0.79 |
| AF347015.27 | -0.71 | -0.77 |
| COPZ2 | -0.69 | -0.72 |
Section V. Pathway annotation
| Pathway name | Pathway size | # SZGR 2.0 genes in pathway | Info |
|---|---|---|---|
| REACTOME METABOLISM OF PROTEINS | 518 | 242 | All SZGR 2.0 genes in this pathway |
| REACTOME POST TRANSLATIONAL PROTEIN MODIFICATION | 188 | 116 | All SZGR 2.0 genes in this pathway |
| REACTOME ASPARAGINE N LINKED GLYCOSYLATION | 81 | 54 | All SZGR 2.0 genes in this pathway |
| REACTOME CALNEXIN CALRETICULIN CYCLE | 11 | 7 | All SZGR 2.0 genes in this pathway |
| REACTOME N GLYCAN TRIMMING IN THE ER AND CALNEXIN CALRETICULIN CYCLE | 13 | 9 | All SZGR 2.0 genes in this pathway |
| FULCHER INFLAMMATORY RESPONSE LECTIN VS LPS UP | 579 | 346 | All SZGR 2.0 genes in this pathway |
| KINSEY TARGETS OF EWSR1 FLII FUSION DN | 329 | 219 | All SZGR 2.0 genes in this pathway |
| DODD NASOPHARYNGEAL CARCINOMA UP | 1821 | 933 | All SZGR 2.0 genes in this pathway |
| MARKEY RB1 ACUTE LOF UP | 215 | 137 | All SZGR 2.0 genes in this pathway |
| RICKMAN TUMOR DIFFERENTIATED WELL VS MODERATELY UP | 109 | 69 | All SZGR 2.0 genes in this pathway |
| PASQUALUCCI LYMPHOMA BY GC STAGE UP | 283 | 177 | All SZGR 2.0 genes in this pathway |
| BENPORATH EED TARGETS | 1062 | 725 | All SZGR 2.0 genes in this pathway |
| NIKOLSKY BREAST CANCER 20Q11 AMPLICON | 31 | 18 | All SZGR 2.0 genes in this pathway |
| ACEVEDO NORMAL TISSUE ADJACENT TO LIVER TUMOR UP | 174 | 96 | All SZGR 2.0 genes in this pathway |
| ACEVEDO LIVER CANCER UP | 973 | 570 | All SZGR 2.0 genes in this pathway |
| BREDEMEYER RAG SIGNALING NOT VIA ATM DN | 57 | 34 | All SZGR 2.0 genes in this pathway |
| ZHANG TLX TARGETS 36HR UP | 221 | 150 | All SZGR 2.0 genes in this pathway |
| MILI PSEUDOPODIA CHEMOTAXIS DN | 457 | 302 | All SZGR 2.0 genes in this pathway |
| LIM MAMMARY STEM CELL DN | 428 | 246 | All SZGR 2.0 genes in this pathway |