Gene Page: DBNDD2
Summary ?
| GeneID | 55861 |
| Symbol | DBNDD2 |
| Synonyms | C20orf35|CK1BP|HSMNP1 |
| Description | dysbindin (dystrobrevin binding protein 1) domain containing 2 |
| Reference | MIM:611453|HGNC:HGNC:15881|Ensembl:ENSG00000244274|HPRD:12763|Vega:OTTHUMG00000032576 |
| Gene type | protein-coding |
| Map location | 20q13.12 |
| Pascal p-value | 0.981 |
| DEG p-value | DEG:Sanders_2014:DS1_p=0.150:DS1_beta=0.029600:DS2_p=4.20e-01:DS2_beta=0.039:DS2_FDR=6.64e-01 |
| Fetal beta | -2.629 |
Gene in Data Sources
| Gene set name | Method of gene set | Description | Info |
|---|---|---|---|
| DEG:Sanders_2013 | Microarray | Whole-genome gene expression profiles using microarrays on lymphoblastoid cell lines (LCLs) from 413 cases and 446 controls. |
Section I. Genetics and epigenetics annotation
Section II. Transcriptome annotation
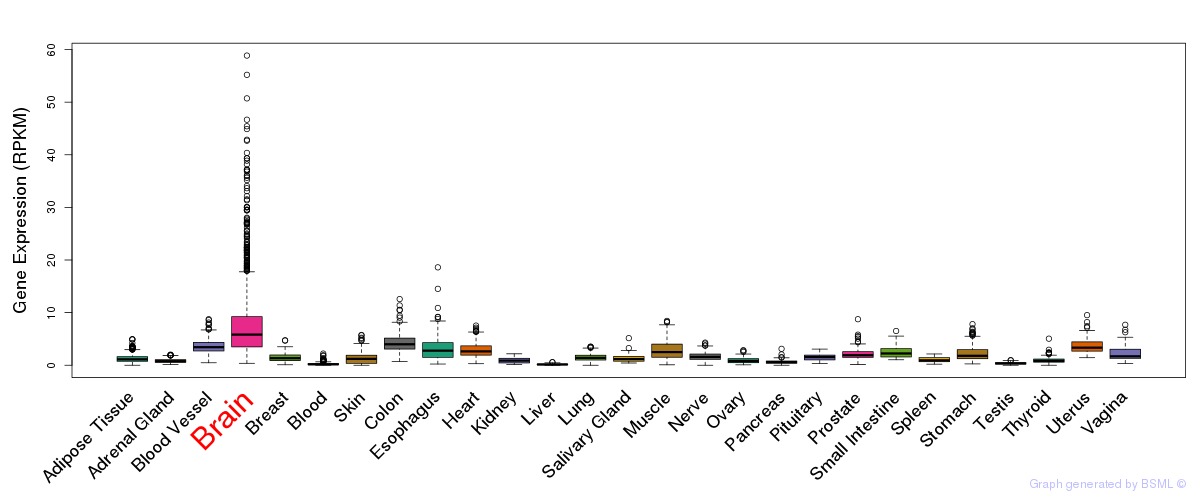
General gene expression (GTEx)

Gene expression during devlopment (BrainCloud)
Footnote:
A total of 269 time points ploted, with n=38 fetal samples (x=1:38). Each triangle represents one time point.
Gene expression of temporal and spatial changes (BrainSpan)
Footnote:
SC: sub-cortical regions; SM: sensory-motor regions; FC: frontal cortex; and TP: temporal-parietal cortex
ST1: fetal (13 - 26 postconception weeks), ST2: early infancy to late childhood (4 months to 11 years), and ST3: adolescence to adulthood (13 - 23 years)
The bar shown representes the lower 25% and upper 25% of the expression distribution.
Top co-expressed genes in brain regions
| Top 10 positively co-expressed genes | ||
| Gene | Pearson's Correlation | Spearman's Correlation |
| GABRB3 | 0.84 | 0.86 |
| PRDM2 | 0.82 | 0.83 |
| AP000843.1 | 0.81 | 0.83 |
| GABRG3 | 0.81 | 0.85 |
| TTL | 0.80 | 0.82 |
| PRICKLE2 | 0.80 | 0.83 |
| MAP2 | 0.80 | 0.84 |
| FAM20B | 0.80 | 0.81 |
| ABI2 | 0.79 | 0.83 |
| SORBS2 | 0.79 | 0.82 |
| Top 10 negatively co-expressed genes | ||
| Gene | Pearson's Correlation | Spearman's Correlation |
| SERPINB6 | -0.64 | -0.67 |
| AL139819.3 | -0.63 | -0.68 |
| AP002478.3 | -0.62 | -0.68 |
| FXYD1 | -0.61 | -0.64 |
| HIGD1B | -0.60 | -0.64 |
| MT-CO2 | -0.60 | -0.64 |
| AF347015.21 | -0.60 | -0.65 |
| RHOC | -0.60 | -0.69 |
| ROM1 | -0.59 | -0.62 |
| AF347015.31 | -0.59 | -0.62 |
Section V. Pathway annotation
| Pathway name | Pathway size | # SZGR 2.0 genes in pathway | Info |
|---|---|---|---|
| CHIARADONNA NEOPLASTIC TRANSFORMATION CDC25 DN | 153 | 100 | All SZGR 2.0 genes in this pathway |
| SHETH LIVER CANCER VS TXNIP LOSS PAM1 | 229 | 137 | All SZGR 2.0 genes in this pathway |
| NUYTTEN NIPP1 TARGETS DN | 848 | 527 | All SZGR 2.0 genes in this pathway |
| LEE LIVER CANCER SURVIVAL DN | 175 | 103 | All SZGR 2.0 genes in this pathway |
| VANTVEER BREAST CANCER ESR1 UP | 167 | 99 | All SZGR 2.0 genes in this pathway |
| HOFFMANN PRE BI TO LARGE PRE BII LYMPHOCYTE DN | 75 | 61 | All SZGR 2.0 genes in this pathway |
| HOFFMANN LARGE TO SMALL PRE BII LYMPHOCYTE DN | 72 | 47 | All SZGR 2.0 genes in this pathway |
| WONG ADULT TISSUE STEM MODULE | 721 | 492 | All SZGR 2.0 genes in this pathway |
| YAO TEMPORAL RESPONSE TO PROGESTERONE CLUSTER 9 | 76 | 45 | All SZGR 2.0 genes in this pathway |
| FIGUEROA AML METHYLATION CLUSTER 7 UP | 118 | 68 | All SZGR 2.0 genes in this pathway |
| GOBERT OLIGODENDROCYTE DIFFERENTIATION DN | 1080 | 713 | All SZGR 2.0 genes in this pathway |
| KRIEG HYPOXIA NOT VIA KDM3A | 770 | 480 | All SZGR 2.0 genes in this pathway |
| SUZUKI CTCFL TARGETS UP | 12 | 5 | All SZGR 2.0 genes in this pathway |
| LIM MAMMARY STEM CELL DN | 428 | 246 | All SZGR 2.0 genes in this pathway |