Gene Page: ZNF317
Summary ?
| GeneID | 57693 |
| Symbol | ZNF317 |
| Synonyms | - |
| Description | zinc finger protein 317 |
| Reference | MIM:613864|HGNC:HGNC:13507|Ensembl:ENSG00000130803|HPRD:11706|Vega:OTTHUMG00000179932 |
| Gene type | protein-coding |
| Map location | 19p13 |
| Pascal p-value | 0.854 |
| Sherlock p-value | 0.388 |
| Fetal beta | -0.025 |
| DMG | 2 (# studies) |
| eGene | Myers' cis & trans |
Gene in Data Sources
| Gene set name | Method of gene set | Description | Info |
|---|---|---|---|
| CV:PGCnp | Genome-wide Association Study | GWAS | |
| DMG:Jaffe_2016 | Genome-wide DNA methylation analysis | This dataset includes 2,104 probes/CpGs associated with SZ patients (n=108) compared to 136 controls at Bonferroni-adjusted P < 0.05. | 2 |
| DMG:Wockner_2014 | Genome-wide DNA methylation analysis | This dataset includes 4641 differentially methylated probes corresponding to 2929 unique genes between schizophrenia patients (n=24) and controls (n=24). | 2 |
Section I. Genetics and epigenetics annotation
 Differentially methylated gene
| Probe | Chromosome | Position | Nearest gene | P (dis) | Beta (dis) | FDR (dis) | Study |
|---|---|---|---|---|---|---|---|
| cg23856540 | 19 | 9251112 | ZNF317 | 1.85E-6 | -0.376 | 0.008 | DMG:Wockner_2014 |
| cg17972606 | 19 | 9251437 | ZNF317 | 3.18E-11 | -0.009 | 3.6E-7 | DMG:Jaffe_2016 |
eQTL annotation
| SNP ID | Chromosome | Position | eGene | Gene Entrez ID | pvalue | qvalue | TSS distance | eQTL type |
|---|---|---|---|---|---|---|---|---|
| rs4355855 | chr9 | 85601817 | ZNF317 | 57693 | 0.17 | trans |
Section II. Transcriptome annotation
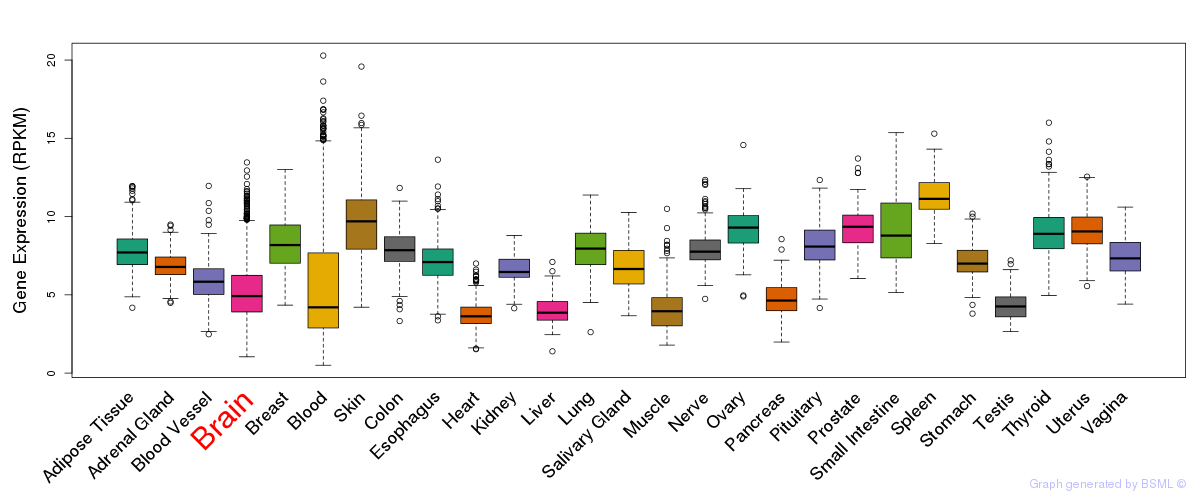
General gene expression (GTEx)
Gene expression during devlopment (BrainCloud)
Footnote:
A total of 269 time points ploted, with n=38 fetal samples (x=1:38). Each triangle represents one time point.
Gene expression of temporal and spatial changes (BrainSpan)
Footnote:
SC: sub-cortical regions; SM: sensory-motor regions; FC: frontal cortex; and TP: temporal-parietal cortex
ST1: fetal (13 - 26 postconception weeks), ST2: early infancy to late childhood (4 months to 11 years), and ST3: adolescence to adulthood (13 - 23 years)
The bar shown representes the lower 25% and upper 25% of the expression distribution.
Top co-expressed genes in brain regions
| Top 10 positively co-expressed genes | ||
| Gene | Pearson's Correlation | Spearman's Correlation |
| CEP164 | 0.62 | 0.59 |
| CEP110 | 0.62 | 0.60 |
| TRIM45 | 0.61 | 0.59 |
| RAD52 | 0.61 | 0.58 |
| MSH5 | 0.61 | 0.52 |
| PNN | 0.61 | 0.54 |
| SETD6 | 0.60 | 0.55 |
| WDR67 | 0.60 | 0.51 |
| CCDC14 | 0.59 | 0.51 |
| FNBP4 | 0.59 | 0.53 |
| Top 10 negatively co-expressed genes | ||
| Gene | Pearson's Correlation | Spearman's Correlation |
| TM4SF1 | -0.37 | -0.40 |
| AF347015.31 | -0.36 | -0.39 |
| IFI27 | -0.36 | -0.39 |
| GIMAP5 | -0.35 | -0.41 |
| HIGD1B | -0.34 | -0.39 |
| AF347015.21 | -0.33 | -0.41 |
| MT-CO2 | -0.33 | -0.36 |
| AF347015.27 | -0.33 | -0.37 |
| MYL3 | -0.33 | -0.40 |
| COPZ2 | -0.33 | -0.36 |
Section V. Pathway annotation
| Pathway name | Pathway size | # SZGR 2.0 genes in pathway | Info |
|---|---|---|---|
| REACTOME GENERIC TRANSCRIPTION PATHWAY | 352 | 181 | All SZGR 2.0 genes in this pathway |
| SENESE HDAC1 TARGETS UP | 457 | 269 | All SZGR 2.0 genes in this pathway |
| SENESE HDAC3 TARGETS UP | 501 | 327 | All SZGR 2.0 genes in this pathway |
| DODD NASOPHARYNGEAL CARCINOMA DN | 1375 | 806 | All SZGR 2.0 genes in this pathway |
| RODRIGUES THYROID CARCINOMA ANAPLASTIC UP | 722 | 443 | All SZGR 2.0 genes in this pathway |
| WANG CISPLATIN RESPONSE AND XPC DN | 228 | 146 | All SZGR 2.0 genes in this pathway |
| ZHANG BREAST CANCER PROGENITORS UP | 425 | 253 | All SZGR 2.0 genes in this pathway |
| MIKKELSEN ES ICP WITH H3K4ME3 | 718 | 401 | All SZGR 2.0 genes in this pathway |
| MIKKELSEN NPC ICP WITH H3K4ME3 | 445 | 257 | All SZGR 2.0 genes in this pathway |