Gene Page: RASA2
Summary ?
| GeneID | 5922 |
| Symbol | RASA2 |
| Synonyms | GAP1M |
| Description | RAS p21 protein activator 2 |
| Reference | MIM:601589|HGNC:HGNC:9872|Ensembl:ENSG00000155903|Vega:OTTHUMG00000160221 |
| Gene type | protein-coding |
| Map location | 3q22-q23 |
| Pascal p-value | 0.47 |
| DMG | 2 (# studies) |
Gene in Data Sources
| Gene set name | Method of gene set | Description | Info |
|---|---|---|---|
| CV:PGCnp | Genome-wide Association Study | GWAS | |
| DMG:Nishioka_2013 | Genome-wide DNA methylation analysis | The authors investigated the methylation profiles of DNA in peripheral blood cells from 18 patients with first-episode schizophrenia (FESZ) and from 15 normal controls. | 2 |
| DMG:Wockner_2014 | Genome-wide DNA methylation analysis | This dataset includes 4641 differentially methylated probes corresponding to 2929 unique genes between schizophrenia patients (n=24) and controls (n=24). | 2 |
Section I. Genetics and epigenetics annotation
 Differentially methylated gene
| Probe | Chromosome | Position | Nearest gene | P (dis) | Beta (dis) | FDR (dis) | Study |
|---|---|---|---|---|---|---|---|
| cg10757852 | 3 | 141319363 | RASA2 | 3.755E-4 | 0.319 | 0.043 | DMG:Wockner_2014 |
| cg26764555 | 3 | 141205540 | RASA2 | -0.026 | 0.73 | DMG:Nishioka_2013 |
Section II. Transcriptome annotation
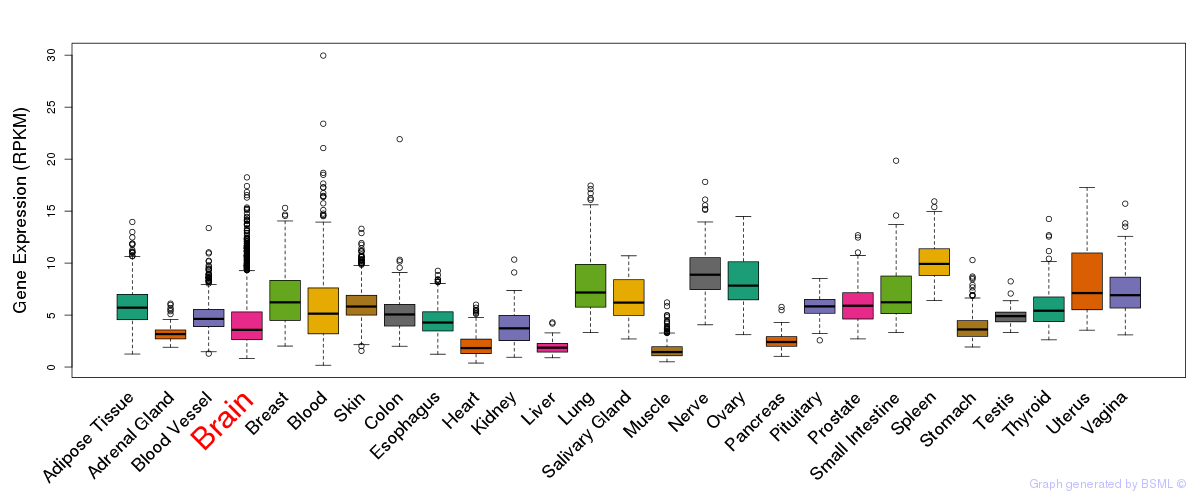
General gene expression (GTEx)

Gene expression of temporal and spatial changes (BrainSpan)
Footnote:
SC: sub-cortical regions; SM: sensory-motor regions; FC: frontal cortex; and TP: temporal-parietal cortex
ST1: fetal (13 - 26 postconception weeks), ST2: early infancy to late childhood (4 months to 11 years), and ST3: adolescence to adulthood (13 - 23 years)
The bar shown representes the lower 25% and upper 25% of the expression distribution.
Top co-expressed genes in brain regions
| Top 10 positively co-expressed genes | ||
| Gene | Pearson's Correlation | Spearman's Correlation |
| AL078612.4 | 0.89 | 0.90 |
| PARD3 | 0.82 | 0.65 |
| PALLD | 0.77 | 0.70 |
| MCM3 | 0.76 | 0.75 |
| CXorf57 | 0.76 | 0.73 |
| MSN | 0.76 | 0.63 |
| CDO1 | 0.75 | 0.62 |
| PDPN | 0.75 | 0.66 |
| JAG1 | 0.75 | 0.64 |
| DNMBP | 0.75 | 0.69 |
| Top 10 negatively co-expressed genes | ||
| Gene | Pearson's Correlation | Spearman's Correlation |
| AF347015.21 | -0.38 | -0.28 |
| MT-CO2 | -0.35 | -0.28 |
| AF347015.31 | -0.34 | -0.26 |
| AF347015.8 | -0.33 | -0.25 |
| MYL3 | -0.33 | -0.24 |
| AF347015.2 | -0.32 | -0.24 |
| AF347015.18 | -0.31 | -0.22 |
| AF347015.27 | -0.31 | -0.24 |
| SYCP3 | -0.30 | -0.27 |
| AF347015.33 | -0.30 | -0.22 |
Section V. Pathway annotation
| Pathway name | Pathway size | # SZGR 2.0 genes in pathway | Info |
|---|---|---|---|
| KEGG MAPK SIGNALING PATHWAY | 267 | 205 | All SZGR 2.0 genes in this pathway |
| PID RAS PATHWAY | 30 | 22 | All SZGR 2.0 genes in this pathway |
| OSMAN BLADDER CANCER UP | 404 | 246 | All SZGR 2.0 genes in this pathway |
| KIM MYCN AMPLIFICATION TARGETS DN | 103 | 59 | All SZGR 2.0 genes in this pathway |
| WANG RESPONSE TO BEXAROTENE UP | 34 | 17 | All SZGR 2.0 genes in this pathway |
| CUI TCF21 TARGETS 2 DN | 830 | 547 | All SZGR 2.0 genes in this pathway |
| BROWNE HCMV INFECTION 14HR DN | 298 | 200 | All SZGR 2.0 genes in this pathway |
| KAYO CALORIE RESTRICTION MUSCLE UP | 95 | 64 | All SZGR 2.0 genes in this pathway |
| SMID BREAST CANCER BASAL UP | 648 | 398 | All SZGR 2.0 genes in this pathway |
| LEE RECENT THYMIC EMIGRANT | 227 | 128 | All SZGR 2.0 genes in this pathway |
| PILON KLF1 TARGETS DN | 1972 | 1213 | All SZGR 2.0 genes in this pathway |
| JOHNSTONE PARVB TARGETS 2 DN | 336 | 211 | All SZGR 2.0 genes in this pathway |
| BRUINS UVC RESPONSE VIA TP53 GROUP A | 898 | 516 | All SZGR 2.0 genes in this pathway |
| BRUINS UVC RESPONSE LATE | 1137 | 655 | All SZGR 2.0 genes in this pathway |
| KOINUMA TARGETS OF SMAD2 OR SMAD3 | 824 | 528 | All SZGR 2.0 genes in this pathway |
| PURBEY TARGETS OF CTBP1 NOT SATB1 UP | 344 | 215 | All SZGR 2.0 genes in this pathway |
| ZWANG CLASS 3 TRANSIENTLY INDUCED BY EGF | 222 | 159 | All SZGR 2.0 genes in this pathway |