Gene Page: STYX
Summary ?
| GeneID | 6815 |
| Symbol | STYX |
| Synonyms | - |
| Description | serine/threonine/tyrosine interacting protein |
| Reference | MIM:615814|HGNC:HGNC:11447|Ensembl:ENSG00000198252|HPRD:10258|Vega:OTTHUMG00000140306 |
| Gene type | protein-coding |
| Map location | - |
| Pascal p-value | 0.817 |
| Fetal beta | 1.515 |
| DMG | 1 (# studies) |
Gene in Data Sources
| Gene set name | Method of gene set | Description | Info |
|---|---|---|---|
| CV:PGCnp | Genome-wide Association Study | GWAS | |
| DMG:Wockner_2014 | Genome-wide DNA methylation analysis | This dataset includes 4641 differentially methylated probes corresponding to 2929 unique genes between schizophrenia patients (n=24) and controls (n=24). | 1 |
Section I. Genetics and epigenetics annotation
 Differentially methylated gene
| Probe | Chromosome | Position | Nearest gene | P (dis) | Beta (dis) | FDR (dis) | Study |
|---|---|---|---|---|---|---|---|
| cg23409613 | 14 | 53196849 | STYX | 4.13E-4 | -0.158 | 0.044 | DMG:Wockner_2014 |
Section II. Transcriptome annotation
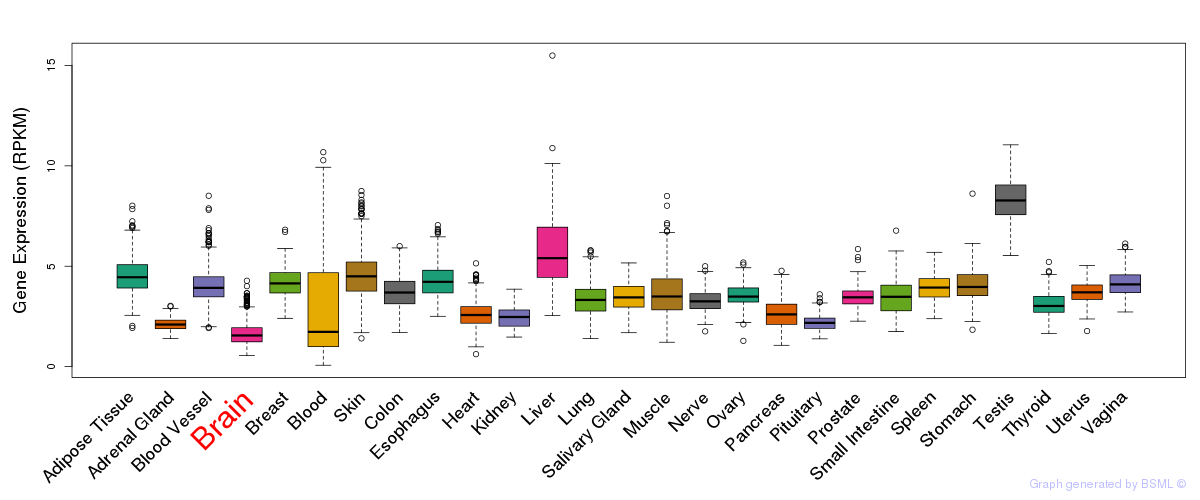
General gene expression (GTEx)
Gene expression during devlopment (BrainCloud)
Footnote:
A total of 269 time points ploted, with n=38 fetal samples (x=1:38). Each triangle represents one time point.
Gene expression of temporal and spatial changes (BrainSpan)
Footnote:
SC: sub-cortical regions; SM: sensory-motor regions; FC: frontal cortex; and TP: temporal-parietal cortex
ST1: fetal (13 - 26 postconception weeks), ST2: early infancy to late childhood (4 months to 11 years), and ST3: adolescence to adulthood (13 - 23 years)
The bar shown representes the lower 25% and upper 25% of the expression distribution.
Top co-expressed genes in brain regions
| Top 10 positively co-expressed genes | ||
| Gene | Pearson's Correlation | Spearman's Correlation |
| SULT4A1 | 0.94 | 0.95 |
| PTPRN | 0.93 | 0.95 |
| AC005277.1 | 0.92 | 0.92 |
| SLC17A7 | 0.90 | 0.78 |
| GRIN1 | 0.90 | 0.91 |
| FMNL1 | 0.89 | 0.90 |
| COPS7A | 0.89 | 0.93 |
| VAMP2 | 0.89 | 0.93 |
| NPTN | 0.89 | 0.93 |
| DUSP3 | 0.89 | 0.91 |
| Top 10 negatively co-expressed genes | ||
| Gene | Pearson's Correlation | Spearman's Correlation |
| GPR125 | -0.48 | -0.41 |
| BCL7C | -0.46 | -0.47 |
| GTF3C6 | -0.45 | -0.37 |
| RPL23A | -0.45 | -0.42 |
| RAB13 | -0.44 | -0.51 |
| RBMX2 | -0.44 | -0.40 |
| C21orf57 | -0.43 | -0.36 |
| FADS2 | -0.43 | -0.31 |
| SH2D2A | -0.43 | -0.40 |
| C9orf46 | -0.43 | -0.37 |
Section V. Pathway annotation
| Pathway name | Pathway size | # SZGR 2.0 genes in pathway | Info |
|---|---|---|---|
| HORIUCHI WTAP TARGETS DN | 310 | 188 | All SZGR 2.0 genes in this pathway |
| SENESE HDAC2 TARGETS UP | 114 | 66 | All SZGR 2.0 genes in this pathway |
| SENESE HDAC3 TARGETS UP | 501 | 327 | All SZGR 2.0 genes in this pathway |
| ROVERSI GLIOMA LOH REGIONS | 44 | 30 | All SZGR 2.0 genes in this pathway |
| NIKOLSKY BREAST CANCER 14Q22 AMPLICON | 14 | 7 | All SZGR 2.0 genes in this pathway |
| IVANOVA HEMATOPOIESIS EARLY PROGENITOR | 532 | 309 | All SZGR 2.0 genes in this pathway |
| MATZUK SPERMATID DIFFERENTIATION | 37 | 26 | All SZGR 2.0 genes in this pathway |
| MILI PSEUDOPODIA HAPTOTAXIS UP | 518 | 299 | All SZGR 2.0 genes in this pathway |
| IVANOVSKA MIR106B TARGETS | 90 | 56 | All SZGR 2.0 genes in this pathway |
| FEVR CTNNB1 TARGETS DN | 553 | 343 | All SZGR 2.0 genes in this pathway |