Gene Page: TTC1
Summary ?
| GeneID | 7265 |
| Symbol | TTC1 |
| Synonyms | TPR1 |
| Description | tetratricopeptide repeat domain 1 |
| Reference | MIM:601963|HGNC:HGNC:12391|Ensembl:ENSG00000113312|HPRD:11881|Vega:OTTHUMG00000130326 |
| Gene type | protein-coding |
| Map location | 5q33.3 |
| Pascal p-value | 0.223 |
| Sherlock p-value | 0.415 |
| Fetal beta | -0.846 |
| eGene | Cerebellar Hemisphere |
Gene in Data Sources
| Gene set name | Method of gene set | Description | Info |
|---|---|---|---|
| CV:GWASdb | Genome-wide Association Studies | GWASdb records for schizophrenia | |
| CV:PGCnp | Genome-wide Association Study | GWAS | |
| GSMA_I | Genome scan meta-analysis | Psr: 0.0032 | |
| GSMA_IIE | Genome scan meta-analysis (European-ancestry samples) | Psr: 0.01718 | |
| GSMA_IIA | Genome scan meta-analysis (All samples) | Psr: 0.00459 | |
| Network | Shortest path distance of core genes in the Human protein-protein interaction network | Contribution to shortest path in PPI network: 0.0393 |
Section I. Genetics and epigenetics annotation
Section II. Transcriptome annotation
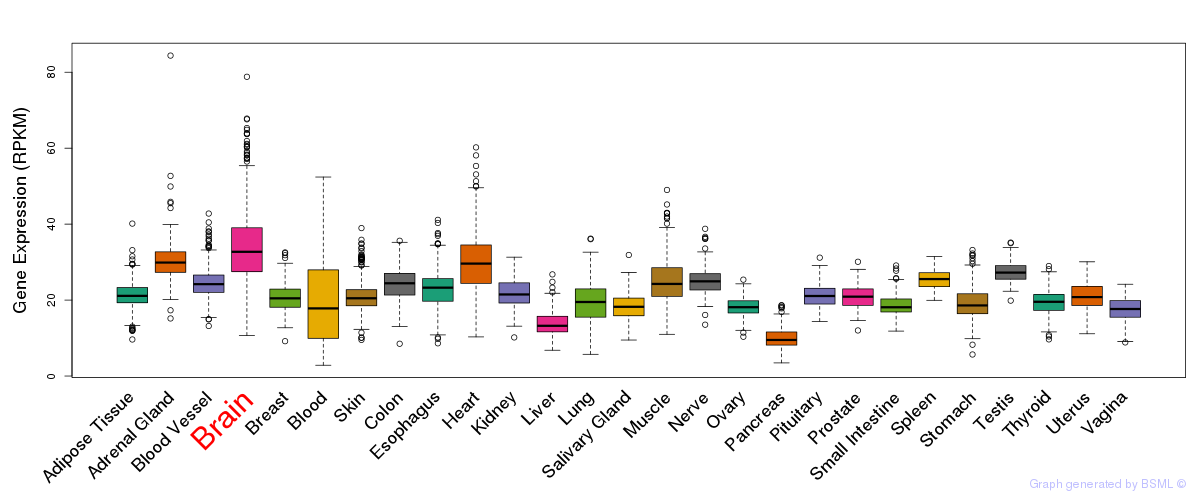
General gene expression (GTEx)
Gene expression during devlopment (BrainCloud)
Footnote:
A total of 269 time points ploted, with n=38 fetal samples (x=1:38). Each triangle represents one time point.
Gene expression of temporal and spatial changes (BrainSpan)
Footnote:
SC: sub-cortical regions; SM: sensory-motor regions; FC: frontal cortex; and TP: temporal-parietal cortex
ST1: fetal (13 - 26 postconception weeks), ST2: early infancy to late childhood (4 months to 11 years), and ST3: adolescence to adulthood (13 - 23 years)
The bar shown representes the lower 25% and upper 25% of the expression distribution.
No co-expressed genes in brain regions
Section III. Gene Ontology annotation
| Molecular function | GO term | Evidence | Neuro keywords | PubMed ID |
|---|---|---|---|---|
| GO:0051082 | unfolded protein binding | TAS | 8836031 | |
| Biological process | GO term | Evidence | Neuro keywords | PubMed ID |
| GO:0006457 | protein folding | TAS | 8836031 |
Section V. Pathway annotation
| Pathway name | Pathway size | # SZGR 2.0 genes in pathway | Info |
|---|---|---|---|
| MULLIGHAN MLL SIGNATURE 1 UP | 380 | 236 | All SZGR 2.0 genes in this pathway |
| TIEN INTESTINE PROBIOTICS 6HR DN | 167 | 100 | All SZGR 2.0 genes in this pathway |
| TIEN INTESTINE PROBIOTICS 24HR UP | 557 | 331 | All SZGR 2.0 genes in this pathway |
| CONCANNON APOPTOSIS BY EPOXOMICIN UP | 239 | 157 | All SZGR 2.0 genes in this pathway |
| HAMAI APOPTOSIS VIA TRAIL UP | 584 | 356 | All SZGR 2.0 genes in this pathway |
| RASHI RESPONSE TO IONIZING RADIATION 5 | 147 | 89 | All SZGR 2.0 genes in this pathway |
| SPIELMAN LYMPHOBLAST EUROPEAN VS ASIAN DN | 584 | 395 | All SZGR 2.0 genes in this pathway |
| STONER ESOPHAGEAL CARCINOGENESIS UP | 39 | 25 | All SZGR 2.0 genes in this pathway |
| BLALOCK ALZHEIMERS DISEASE DN | 1237 | 837 | All SZGR 2.0 genes in this pathway |
| MOOTHA PGC | 420 | 269 | All SZGR 2.0 genes in this pathway |
| MILI PSEUDOPODIA HAPTOTAXIS UP | 518 | 299 | All SZGR 2.0 genes in this pathway |
| NIELSEN GIST | 98 | 66 | All SZGR 2.0 genes in this pathway |
| KIM ALL DISORDERS OLIGODENDROCYTE NUMBER CORR UP | 756 | 494 | All SZGR 2.0 genes in this pathway |
| KIM BIPOLAR DISORDER OLIGODENDROCYTE DENSITY CORR UP | 682 | 440 | All SZGR 2.0 genes in this pathway |
| VERHAAK GLIOBLASTOMA NEURAL | 129 | 85 | All SZGR 2.0 genes in this pathway |
| BRUINS UVC RESPONSE VIA TP53 GROUP A | 898 | 516 | All SZGR 2.0 genes in this pathway |